Despite Its High P/E Ratio, Is Beijing Chunlizhengda Medical Instruments Co., Ltd. (HKG:1858) Still Undervalued?

Want to participate in a short research study? Help shape the future of investing tools and you could win a $250 gift card!
Today, we'll introduce the concept of the P/E ratio for those who are learning about investing. We'll show how you can use Beijing Chunlizhengda Medical Instruments Co., Ltd.'s (HKG:1858) P/E ratio to inform your assessment of the investment opportunity. What is Beijing Chunlizhengda Medical Instruments's P/E ratio? Well, based on the last twelve months it is 18.56. In other words, at today's prices, investors are paying HK$18.56 for every HK$1 in prior year profit.
View our latest analysis for Beijing Chunlizhengda Medical Instruments
How Do You Calculate A P/E Ratio?
The formula for price to earnings is:
Price to Earnings Ratio = Price per Share (in the reporting currency) ÷ Earnings per Share (EPS)
Or for Beijing Chunlizhengda Medical Instruments:
P/E of 18.56 = CN¥14.2 (Note: this is the share price in the reporting currency, namely, CNY ) ÷ CN¥0.77 (Based on the year to December 2018.)
Is A High Price-to-Earnings Ratio Good?
A higher P/E ratio means that investors are paying a higher price for each HK$1 of company earnings. That is not a good or a bad thing per se, but a high P/E does imply buyers are optimistic about the future.
How Growth Rates Impact P/E Ratios
Probably the most important factor in determining what P/E a company trades on is the earnings growth. If earnings are growing quickly, then the 'E' in the equation will increase faster than it would otherwise. That means even if the current P/E is high, it will reduce over time if the share price stays flat. So while a stock may look expensive based on past earnings, it could be cheap based on future earnings.
Beijing Chunlizhengda Medical Instruments's earnings made like a rocket, taking off 55% last year. The cherry on top is that the five year growth rate was an impressive 19% per year. With that kind of growth rate we would generally expect a high P/E ratio.
Does Beijing Chunlizhengda Medical Instruments Have A Relatively High Or Low P/E For Its Industry?
The P/E ratio essentially measures market expectations of a company. The image below shows that Beijing Chunlizhengda Medical Instruments has a higher P/E than the average (16.7) P/E for companies in the medical equipment industry.
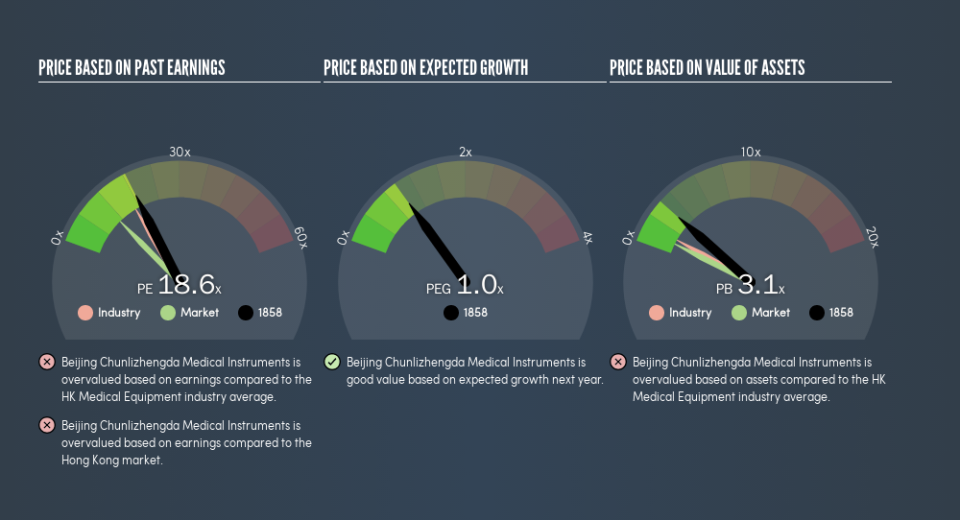
Its relatively high P/E ratio indicates that Beijing Chunlizhengda Medical Instruments shareholders think it will perform better than other companies in its industry classification. Clearly the market expects growth, but it isn't guaranteed. So further research is always essential. I often monitor director buying and selling.
A Limitation: P/E Ratios Ignore Debt and Cash In The Bank
The 'Price' in P/E reflects the market capitalization of the company. That means it doesn't take debt or cash into account. In theory, a company can lower its future P/E ratio by using cash or debt to invest in growth.
Such spending might be good or bad, overall, but the key point here is that you need to look at debt to understand the P/E ratio in context.
How Does Beijing Chunlizhengda Medical Instruments's Debt Impact Its P/E Ratio?
With net cash of CN¥415m, Beijing Chunlizhengda Medical Instruments has a very strong balance sheet, which may be important for its business. Having said that, at 21% of its market capitalization the cash hoard would contribute towards a higher P/E ratio.
The Bottom Line On Beijing Chunlizhengda Medical Instruments's P/E Ratio
Beijing Chunlizhengda Medical Instruments's P/E is 18.6 which is above average (11) in the HK market. The excess cash it carries is the gravy on top its fast EPS growth. To us, this is the sort of company that we would expect to carry an above average price tag (relative to earnings).
When the market is wrong about a stock, it gives savvy investors an opportunity. If the reality for a company is better than it expects, you can make money by buying and holding for the long term. So this free visual report on analyst forecasts could hold the key to an excellent investment decision.
Of course, you might find a fantastic investment by looking at a few good candidates. So take a peek at this free list of companies with modest (or no) debt, trading on a P/E below 20.
We aim to bring you long-term focused research analysis driven by fundamental data. Note that our analysis may not factor in the latest price-sensitive company announcements or qualitative material.
If you spot an error that warrants correction, please contact the editor at editorial-team@simplywallst.com. This article by Simply Wall St is general in nature. It does not constitute a recommendation to buy or sell any stock, and does not take account of your objectives, or your financial situation. Simply Wall St has no position in the stocks mentioned. Thank you for reading.
