Despite Its High P/E Ratio, Is South China Holdings Company Limited (HKG:413) Still Undervalued?

This article is written for those who want to get better at using price to earnings ratios (P/E ratios). We'll apply a basic P/E ratio analysis to South China Holdings Company Limited's (HKG:413), to help you decide if the stock is worth further research. Based on the last twelve months, South China Holdings's P/E ratio is 13.11. That means that at current prices, buyers pay HK$13.11 for every HK$1 in trailing yearly profits.
See our latest analysis for South China Holdings
How Do I Calculate A Price To Earnings Ratio?
The formula for price to earnings is:
Price to Earnings Ratio = Share Price ÷ Earnings per Share (EPS)
Or for South China Holdings:
P/E of 13.11 = HK$0.17 ÷ HK$0.01 (Based on the trailing twelve months to June 2019.)
Is A High Price-to-Earnings Ratio Good?
A higher P/E ratio implies that investors pay a higher price for the earning power of the business. That isn't necessarily good or bad, but a high P/E implies relatively high expectations of what a company can achieve in the future.
How Does South China Holdings's P/E Ratio Compare To Its Peers?
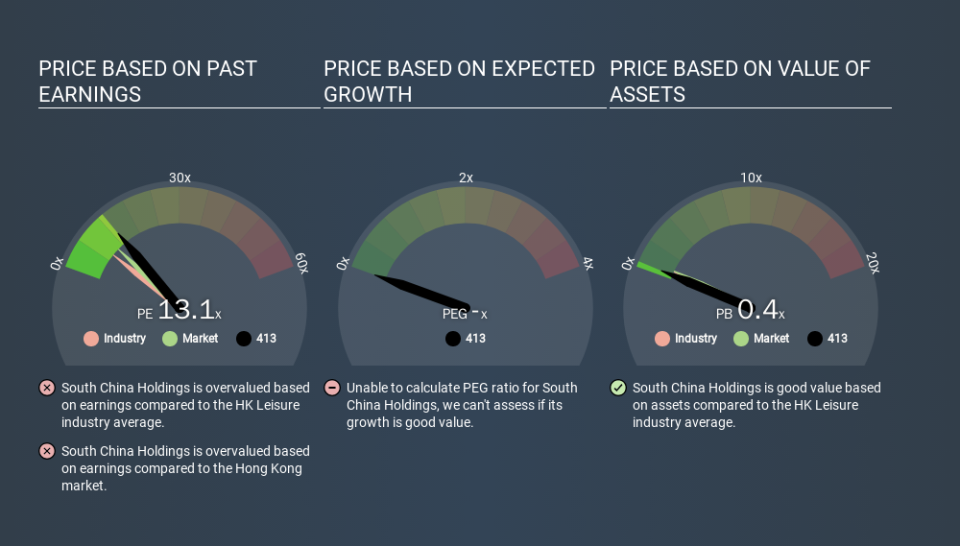
We can get an indication of market expectations by looking at the P/E ratio. The image below shows that South China Holdings has a higher P/E than the average (8.0) P/E for companies in the leisure industry.
South China Holdings's P/E tells us that market participants think the company will perform better than its industry peers, going forward. The market is optimistic about the future, but that doesn't guarantee future growth. So investors should delve deeper. I like to check if company insiders have been buying or selling.
How Growth Rates Impact P/E Ratios
P/E ratios primarily reflect market expectations around earnings growth rates. Earnings growth means that in the future the 'E' will be higher. That means even if the current P/E is high, it will reduce over time if the share price stays flat. So while a stock may look expensive based on past earnings, it could be cheap based on future earnings.
South China Holdings shrunk earnings per share by 16% over the last year. But EPS is up 50% over the last 3 years. And over the longer term (5 years) earnings per share have decreased 14% annually. This growth rate might warrant a below average P/E ratio.
Remember: P/E Ratios Don't Consider The Balance Sheet
One drawback of using a P/E ratio is that it considers market capitalization, but not the balance sheet. That means it doesn't take debt or cash into account. Hypothetically, a company could reduce its future P/E ratio by spending its cash (or taking on debt) to achieve higher earnings.
Such spending might be good or bad, overall, but the key point here is that you need to look at debt to understand the P/E ratio in context.
Is Debt Impacting South China Holdings's P/E?
South China Holdings's net debt is considerable, at 194% of its market cap. If you want to compare its P/E ratio to other companies, you must keep in mind that these debt levels would usually warrant a relatively low P/E.
The Verdict On South China Holdings's P/E Ratio
South China Holdings has a P/E of 13.1. That's higher than the average in its market, which is 10.3. With meaningful debt and a lack of recent earnings growth, the market has high expectations that the business will earn more in the future.
Investors have an opportunity when market expectations about a stock are wrong. People often underestimate remarkable growth -- so investors can make money when fast growth is not fully appreciated. Although we don't have analyst forecasts you might want to assess this data-rich visualization of earnings, revenue and cash flow.
You might be able to find a better buy than South China Holdings. If you want a selection of possible winners, check out this free list of interesting companies that trade on a P/E below 20 (but have proven they can grow earnings).
If you spot an error that warrants correction, please contact the editor at editorial-team@simplywallst.com. This article by Simply Wall St is general in nature. It does not constitute a recommendation to buy or sell any stock, and does not take account of your objectives, or your financial situation. Simply Wall St has no position in the stocks mentioned.
We aim to bring you long-term focused research analysis driven by fundamental data. Note that our analysis may not factor in the latest price-sensitive company announcements or qualitative material. Thank you for reading.

