Despite Its High P/E Ratio, Is BTS Group AB (publ) (STO:BTS B) Still Undervalued?

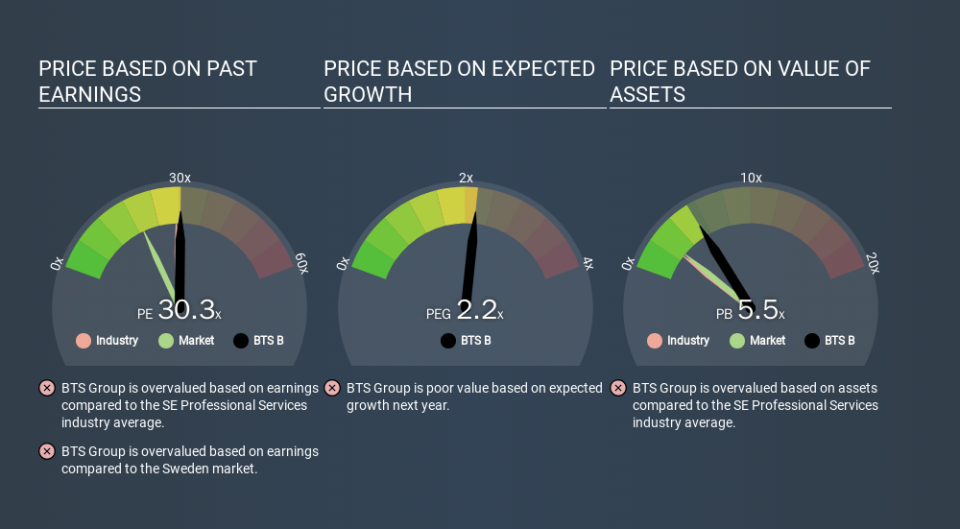
Today, we'll introduce the concept of the P/E ratio for those who are learning about investing. To keep it practical, we'll show how BTS Group AB (publ)'s (STO:BTS B) P/E ratio could help you assess the value on offer. What is BTS Group's P/E ratio? Well, based on the last twelve months it is 30.28. That is equivalent to an earnings yield of about 3.3%.
View our latest analysis for BTS Group
How Do You Calculate A P/E Ratio?
The formula for price to earnings is:
Price to Earnings Ratio = Price per Share ÷ Earnings per Share (EPS)
Or for BTS Group:
P/E of 30.28 = SEK237.50 ÷ SEK7.84 (Based on the year to December 2019.)
Is A High P/E Ratio Good?
A higher P/E ratio means that buyers have to pay a higher price for each SEK1 the company has earned over the last year. That isn't a good or a bad thing on its own, but a high P/E means that buyers have a higher opinion of the business's prospects, relative to stocks with a lower P/E.
Does BTS Group Have A Relatively High Or Low P/E For Its Industry?
The P/E ratio essentially measures market expectations of a company. The image below shows that BTS Group has a higher P/E than the average (27.5) P/E for companies in the professional services industry.
That means that the market expects BTS Group will outperform other companies in its industry. Shareholders are clearly optimistic, but the future is always uncertain. So further research is always essential. I often monitor director buying and selling.
How Growth Rates Impact P/E Ratios
Probably the most important factor in determining what P/E a company trades on is the earnings growth. Earnings growth means that in the future the 'E' will be higher. That means unless the share price increases, the P/E will reduce in a few years. And as that P/E ratio drops, the company will look cheap, unless its share price increases.
It's great to see that BTS Group grew EPS by 18% in the last year. And it has bolstered its earnings per share by 21% per year over the last five years. This could arguably justify a relatively high P/E ratio.
Remember: P/E Ratios Don't Consider The Balance Sheet
One drawback of using a P/E ratio is that it considers market capitalization, but not the balance sheet. That means it doesn't take debt or cash into account. The exact same company would hypothetically deserve a higher P/E ratio if it had a strong balance sheet, than if it had a weak one with lots of debt, because a cashed up company can spend on growth.
Such expenditure might be good or bad, in the long term, but the point here is that the balance sheet is not reflected by this ratio.
BTS Group's Balance Sheet
BTS Group has net cash of kr216m. That should lead to a higher P/E than if it did have debt, because its strong balance sheets gives it more options.
The Verdict On BTS Group's P/E Ratio
BTS Group has a P/E of 30.3. That's higher than the average in its market, which is 18.6. Its strong balance sheet gives the company plenty of resources for extra growth, and it has already proven it can grow. Therefore it seems reasonable that the market would have relatively high expectations of the company
Investors should be looking to buy stocks that the market is wrong about. People often underestimate remarkable growth -- so investors can make money when fast growth is not fully appreciated. So this free visualization of the analyst consensus on future earnings could help you make the right decision about whether to buy, sell, or hold.
Of course, you might find a fantastic investment by looking at a few good candidates. So take a peek at this free list of companies with modest (or no) debt, trading on a P/E below 20.
If you spot an error that warrants correction, please contact the editor at editorial-team@simplywallst.com. This article by Simply Wall St is general in nature. It does not constitute a recommendation to buy or sell any stock, and does not take account of your objectives, or your financial situation. Simply Wall St has no position in the stocks mentioned.
We aim to bring you long-term focused research analysis driven by fundamental data. Note that our analysis may not factor in the latest price-sensitive company announcements or qualitative material. Thank you for reading.
