Despite Its High P/E Ratio, Is CML Microsystems plc (LON:CML) Still Undervalued?

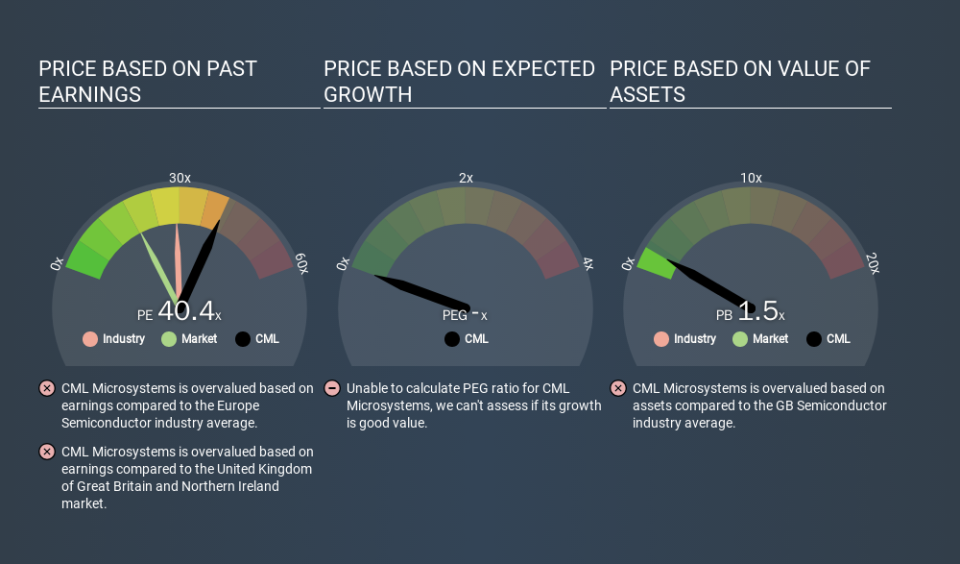
Today, we'll introduce the concept of the P/E ratio for those who are learning about investing. We'll show how you can use CML Microsystems plc's (LON:CML) P/E ratio to inform your assessment of the investment opportunity. Looking at earnings over the last twelve months, CML Microsystems has a P/E ratio of 40.43. That corresponds to an earnings yield of approximately 2.5%.
View our latest analysis for CML Microsystems
How Do You Calculate A P/E Ratio?
The formula for price to earnings is:
Price to Earnings Ratio = Price per Share ÷ Earnings per Share (EPS)
Or for CML Microsystems:
P/E of 40.43 = GBP3.69 ÷ GBP0.09 (Based on the trailing twelve months to September 2019.)
Is A High Price-to-Earnings Ratio Good?
A higher P/E ratio means that investors are paying a higher price for each GBP1 of company earnings. That isn't necessarily good or bad, but a high P/E implies relatively high expectations of what a company can achieve in the future.
How Does CML Microsystems's P/E Ratio Compare To Its Peers?
The P/E ratio essentially measures market expectations of a company. As you can see below, CML Microsystems has a higher P/E than the average company (28.6) in the semiconductor industry.
Its relatively high P/E ratio indicates that CML Microsystems shareholders think it will perform better than other companies in its industry classification. Clearly the market expects growth, but it isn't guaranteed. So further research is always essential. I often monitor director buying and selling.
How Growth Rates Impact P/E Ratios
If earnings fall then in the future the 'E' will be lower. That means unless the share price falls, the P/E will increase in a few years. So while a stock may look cheap based on past earnings, it could be expensive based on future earnings.
CML Microsystems shrunk earnings per share by 64% over the last year. And it has shrunk its earnings per share by 15% per year over the last five years. This could justify a pessimistic P/E.
A Limitation: P/E Ratios Ignore Debt and Cash In The Bank
It's important to note that the P/E ratio considers the market capitalization, not the enterprise value. So it won't reflect the advantage of cash, or disadvantage of debt. The exact same company would hypothetically deserve a higher P/E ratio if it had a strong balance sheet, than if it had a weak one with lots of debt, because a cashed up company can spend on growth.
Such spending might be good or bad, overall, but the key point here is that you need to look at debt to understand the P/E ratio in context.
So What Does CML Microsystems's Balance Sheet Tell Us?
With net cash of UK£11m, CML Microsystems has a very strong balance sheet, which may be important for its business. Having said that, at 18% of its market capitalization the cash hoard would contribute towards a higher P/E ratio.
The Bottom Line On CML Microsystems's P/E Ratio
CML Microsystems's P/E is 40.4 which is above average (18.3) in its market. Falling earnings per share is probably keeping traditional value investors away, but the relatively strong balance sheet will allow the company time to invest in growth. Clearly, the high P/E indicates shareholders think it will!
Investors have an opportunity when market expectations about a stock are wrong. If the reality for a company is better than it expects, you can make money by buying and holding for the long term. So this free visual report on analyst forecasts could hold the key to an excellent investment decision.
Of course, you might find a fantastic investment by looking at a few good candidates. So take a peek at this free list of companies with modest (or no) debt, trading on a P/E below 20.
If you spot an error that warrants correction, please contact the editor at editorial-team@simplywallst.com. This article by Simply Wall St is general in nature. It does not constitute a recommendation to buy or sell any stock, and does not take account of your objectives, or your financial situation. Simply Wall St has no position in the stocks mentioned.
We aim to bring you long-term focused research analysis driven by fundamental data. Note that our analysis may not factor in the latest price-sensitive company announcements or qualitative material. Thank you for reading.

