Despite Its High P/E Ratio, Is Eurofins Scientific SE (EPA:ERF) Still Undervalued?

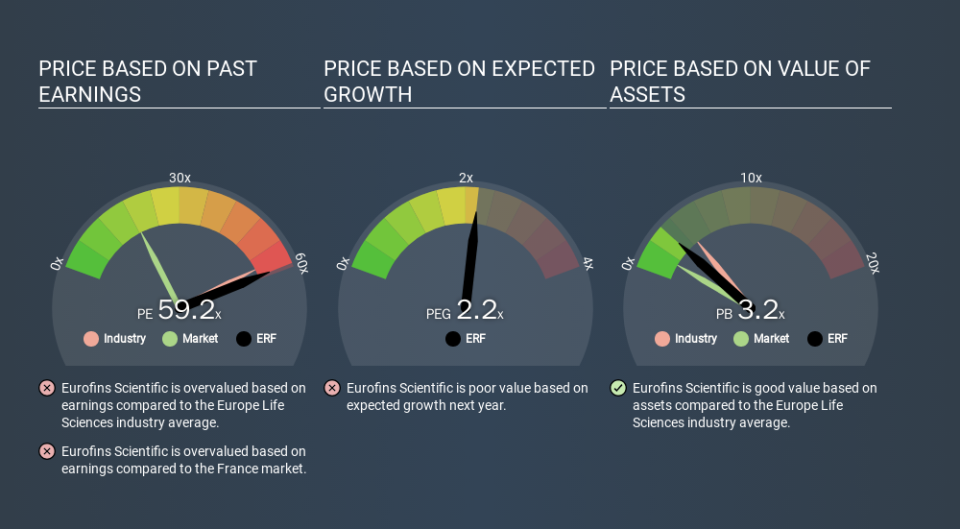
The goal of this article is to teach you how to use price to earnings ratios (P/E ratios). We'll look at Eurofins Scientific SE's (EPA:ERF) P/E ratio and reflect on what it tells us about the company's share price. Eurofins Scientific has a P/E ratio of 59.19, based on the last twelve months. That means that at current prices, buyers pay €59.19 for every €1 in trailing yearly profits.
See our latest analysis for Eurofins Scientific
How Do You Calculate A P/E Ratio?
The formula for P/E is:
Price to Earnings Ratio = Share Price ÷ Earnings per Share (EPS)
Or for Eurofins Scientific:
P/E of 59.19 = EUR477.20 ÷ EUR8.06 (Based on the year to June 2019.)
Is A High Price-to-Earnings Ratio Good?
A higher P/E ratio implies that investors pay a higher price for the earning power of the business. That isn't necessarily good or bad, but a high P/E implies relatively high expectations of what a company can achieve in the future.
How Does Eurofins Scientific's P/E Ratio Compare To Its Peers?
One good way to get a quick read on what market participants expect of a company is to look at its P/E ratio. You can see in the image below that the average P/E (57.4) for companies in the life sciences industry is roughly the same as Eurofins Scientific's P/E.
That indicates that the market expects Eurofins Scientific will perform roughly in line with other companies in its industry. So if Eurofins Scientific actually outperforms its peers going forward, that should be a positive for the share price. Checking factors such as director buying and selling. could help you form your own view on if that will happen.
How Growth Rates Impact P/E Ratios
P/E ratios primarily reflect market expectations around earnings growth rates. If earnings are growing quickly, then the 'E' in the equation will increase faster than it would otherwise. Therefore, even if you pay a high multiple of earnings now, that multiple will become lower in the future. And as that P/E ratio drops, the company will look cheap, unless its share price increases.
Eurofins Scientific saw earnings per share decrease by 26% last year. But EPS is up 18% over the last 5 years.
Remember: P/E Ratios Don't Consider The Balance Sheet
The 'Price' in P/E reflects the market capitalization of the company. In other words, it does not consider any debt or cash that the company may have on the balance sheet. In theory, a company can lower its future P/E ratio by using cash or debt to invest in growth.
Such spending might be good or bad, overall, but the key point here is that you need to look at debt to understand the P/E ratio in context.
How Does Eurofins Scientific's Debt Impact Its P/E Ratio?
Eurofins Scientific has net debt equal to 31% of its market cap. You'd want to be aware of this fact, but it doesn't bother us.
The Verdict On Eurofins Scientific's P/E Ratio
Eurofins Scientific's P/E is 59.2 which suggests the market is more focussed on the future opportunity rather than the current level of earnings. With some debt but no EPS growth last year, the market has high expectations of future profits.
Investors should be looking to buy stocks that the market is wrong about. If the reality for a company is better than it expects, you can make money by buying and holding for the long term. So this free visualization of the analyst consensus on future earnings could help you make the right decision about whether to buy, sell, or hold.
But note: Eurofins Scientific may not be the best stock to buy. So take a peek at this free list of interesting companies with strong recent earnings growth (and a P/E ratio below 20).
If you spot an error that warrants correction, please contact the editor at editorial-team@simplywallst.com. This article by Simply Wall St is general in nature. It does not constitute a recommendation to buy or sell any stock, and does not take account of your objectives, or your financial situation. Simply Wall St has no position in the stocks mentioned.
We aim to bring you long-term focused research analysis driven by fundamental data. Note that our analysis may not factor in the latest price-sensitive company announcements or qualitative material. Thank you for reading.

