Despite Its High P/E Ratio, Is Hing Ming Holdings Limited (HKG:8425) Still Undervalued?

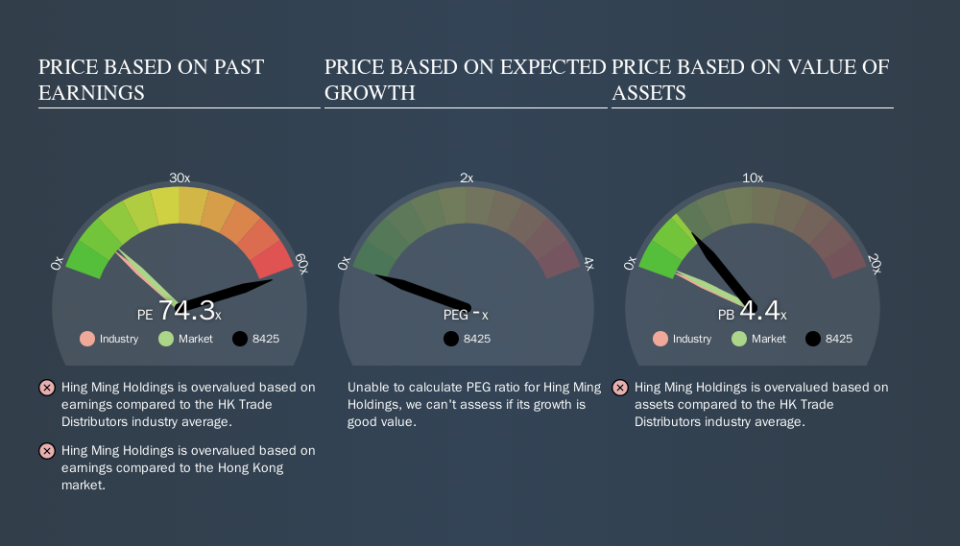
The goal of this article is to teach you how to use price to earnings ratios (P/E ratios). We'll apply a basic P/E ratio analysis to Hing Ming Holdings Limited's (HKG:8425), to help you decide if the stock is worth further research. Hing Ming Holdings has a P/E ratio of 74.26, based on the last twelve months. That is equivalent to an earnings yield of about 1.3%.
Check out our latest analysis for Hing Ming Holdings
How Do You Calculate A P/E Ratio?
The formula for price to earnings is:
Price to Earnings Ratio = Price per Share ÷ Earnings per Share (EPS)
Or for Hing Ming Holdings:
P/E of 74.26 = HK$1.32 ÷ HK$0.02 (Based on the year to June 2019.)
Is A High P/E Ratio Good?
A higher P/E ratio means that buyers have to pay a higher price for each HK$1 the company has earned over the last year. All else being equal, it's better to pay a low price -- but as Warren Buffett said, 'It's far better to buy a wonderful company at a fair price than a fair company at a wonderful price.
How Does Hing Ming Holdings's P/E Ratio Compare To Its Peers?
One good way to get a quick read on what market participants expect of a company is to look at its P/E ratio. You can see in the image below that the average P/E (9.3) for companies in the trade distributors industry is a lot lower than Hing Ming Holdings's P/E.
Its relatively high P/E ratio indicates that Hing Ming Holdings shareholders think it will perform better than other companies in its industry classification. Shareholders are clearly optimistic, but the future is always uncertain. So investors should delve deeper. I like to check if company insiders have been buying or selling.
How Growth Rates Impact P/E Ratios
If earnings fall then in the future the 'E' will be lower. That means even if the current P/E is low, it will increase over time if the share price stays flat. A higher P/E should indicate the stock is expensive relative to others -- and that may encourage shareholders to sell.
Hing Ming Holdings saw earnings per share decrease by 48% last year. And it has shrunk its earnings per share by 18% per year over the last three years. This could justify a low P/E.
Remember: P/E Ratios Don't Consider The Balance Sheet
It's important to note that the P/E ratio considers the market capitalization, not the enterprise value. That means it doesn't take debt or cash into account. Theoretically, a business can improve its earnings (and produce a lower P/E in the future) by investing in growth. That means taking on debt (or spending its cash).
Such expenditure might be good or bad, in the long term, but the point here is that the balance sheet is not reflected by this ratio.
Hing Ming Holdings's Balance Sheet
Since Hing Ming Holdings holds net cash of HK$39m, it can spend on growth, justifying a higher P/E ratio than otherwise.
The Bottom Line On Hing Ming Holdings's P/E Ratio
Hing Ming Holdings's P/E is 74.3 which suggests the market is more focussed on the future opportunity rather than the current level of earnings. Falling earnings per share is probably keeping traditional value investors away, but the relatively strong balance sheet will allow the company time to invest in growth. Clearly, the high P/E indicates shareholders think it will!
Investors should be looking to buy stocks that the market is wrong about. If the reality for a company is better than it expects, you can make money by buying and holding for the long term. Although we don't have analyst forecasts you might want to assess this data-rich visualization of earnings, revenue and cash flow.
You might be able to find a better buy than Hing Ming Holdings. If you want a selection of possible winners, check out this free list of interesting companies that trade on a P/E below 20 (but have proven they can grow earnings).
We aim to bring you long-term focused research analysis driven by fundamental data. Note that our analysis may not factor in the latest price-sensitive company announcements or qualitative material.
If you spot an error that warrants correction, please contact the editor at editorial-team@simplywallst.com. This article by Simply Wall St is general in nature. It does not constitute a recommendation to buy or sell any stock, and does not take account of your objectives, or your financial situation. Simply Wall St has no position in the stocks mentioned. Thank you for reading.
