Despite Its High P/E Ratio, Is Duni AB (publ) (STO:DUNI) Still Undervalued?

This article is written for those who want to get better at using price to earnings ratios (P/E ratios). We'll look at Duni AB (publ)'s (STO:DUNI) P/E ratio and reflect on what it tells us about the company's share price. Duni has a P/E ratio of 22.34, based on the last twelve months. In other words, at today's prices, investors are paying SEK22.34 for every SEK1 in prior year profit.
View our latest analysis for Duni
How Do You Calculate A P/E Ratio?
The formula for price to earnings is:
Price to Earnings Ratio = Price per Share ÷ Earnings per Share (EPS)
Or for Duni:
P/E of 22.34 = SEK121.20 ÷ SEK5.43 (Based on the year to September 2019.)
Is A High Price-to-Earnings Ratio Good?
A higher P/E ratio means that investors are paying a higher price for each SEK1 of company earnings. All else being equal, it's better to pay a low price -- but as Warren Buffett said, 'It's far better to buy a wonderful company at a fair price than a fair company at a wonderful price.
Does Duni Have A Relatively High Or Low P/E For Its Industry?
We can get an indication of market expectations by looking at the P/E ratio. The image below shows that Duni has a higher P/E than the average (15.2) P/E for companies in the consumer durables industry.
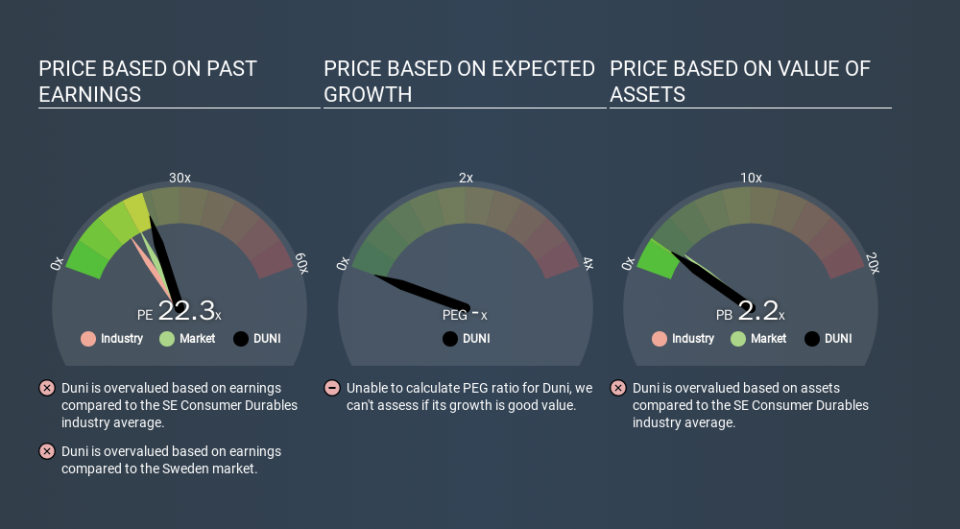
That means that the market expects Duni will outperform other companies in its industry. Clearly the market expects growth, but it isn't guaranteed. So further research is always essential. I often monitor director buying and selling.
How Growth Rates Impact P/E Ratios
When earnings fall, the 'E' decreases, over time. Therefore, even if you pay a low multiple of earnings now, that multiple will become higher in the future. A higher P/E should indicate the stock is expensive relative to others -- and that may encourage shareholders to sell.
Duni's earnings per share fell by 17% in the last twelve months. And over the longer term (5 years) earnings per share have decreased 3.4% annually. This growth rate might warrant a below average P/E ratio.
Don't Forget: The P/E Does Not Account For Debt or Bank Deposits
It's important to note that the P/E ratio considers the market capitalization, not the enterprise value. Thus, the metric does not reflect cash or debt held by the company. Theoretically, a business can improve its earnings (and produce a lower P/E in the future) by investing in growth. That means taking on debt (or spending its cash).
Spending on growth might be good or bad a few years later, but the point is that the P/E ratio does not account for the option (or lack thereof).
Duni's Balance Sheet
Net debt is 26% of Duni's market cap. While that's enough to warrant consideration, it doesn't really concern us.
The Verdict On Duni's P/E Ratio
Duni has a P/E of 22.3. That's higher than the average in its market, which is 18.4. With some debt but no EPS growth last year, the market has high expectations of future profits.
When the market is wrong about a stock, it gives savvy investors an opportunity. If the reality for a company is better than it expects, you can make money by buying and holding for the long term. Although we don't have analyst forecasts you could get a better understanding of its growth by checking out this more detailed historical graph of earnings, revenue and cash flow.
You might be able to find a better buy than Duni. If you want a selection of possible winners, check out this free list of interesting companies that trade on a P/E below 20 (but have proven they can grow earnings).
If you spot an error that warrants correction, please contact the editor at editorial-team@simplywallst.com. This article by Simply Wall St is general in nature. It does not constitute a recommendation to buy or sell any stock, and does not take account of your objectives, or your financial situation. Simply Wall St has no position in the stocks mentioned.
We aim to bring you long-term focused research analysis driven by fundamental data. Note that our analysis may not factor in the latest price-sensitive company announcements or qualitative material. Thank you for reading.
