Despite Its High P/E Ratio, Is Novisource N.V. (AMS:NOVI) Still Undervalued?

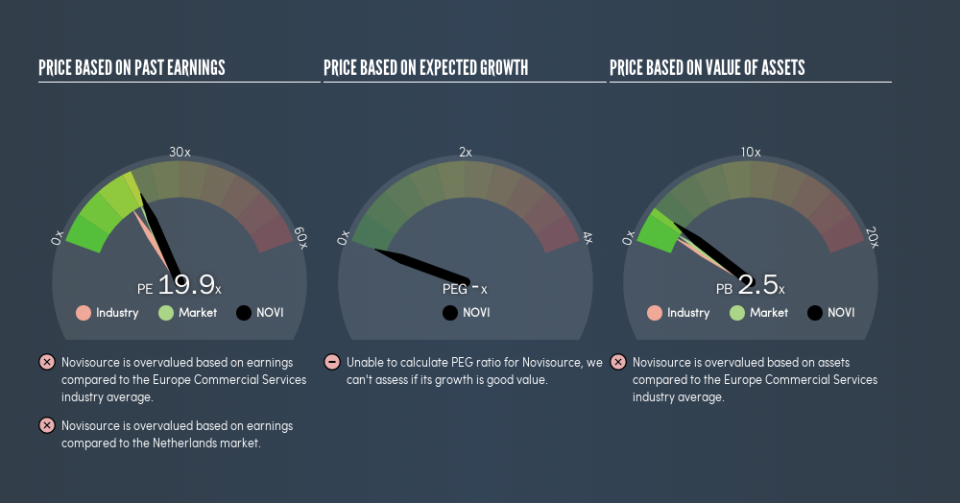
The goal of this article is to teach you how to use price to earnings ratios (P/E ratios). To keep it practical, we'll show how Novisource N.V.'s (AMS:NOVI) P/E ratio could help you assess the value on offer. Looking at earnings over the last twelve months, Novisource has a P/E ratio of 19.87. In other words, at today's prices, investors are paying €19.87 for every €1 in prior year profit.
View our latest analysis for Novisource
How Do You Calculate A P/E Ratio?
The formula for P/E is:
Price to Earnings Ratio = Price per Share ÷ Earnings per Share (EPS)
Or for Novisource:
P/E of 19.87 = €1.04 ÷ €0.052 (Based on the trailing twelve months to December 2018.)
Is A High Price-to-Earnings Ratio Good?
A higher P/E ratio means that buyers have to pay a higher price for each €1 the company has earned over the last year. All else being equal, it's better to pay a low price -- but as Warren Buffett said, 'It's far better to buy a wonderful company at a fair price than a fair company at a wonderful price.'
Does Novisource Have A Relatively High Or Low P/E For Its Industry?
The P/E ratio essentially measures market expectations of a company. As you can see below, Novisource has a higher P/E than the average company (16) in the commercial services industry.
Its relatively high P/E ratio indicates that Novisource shareholders think it will perform better than other companies in its industry classification. The market is optimistic about the future, but that doesn't guarantee future growth. So further research is always essential. I often monitor director buying and selling.
How Growth Rates Impact P/E Ratios
P/E ratios primarily reflect market expectations around earnings growth rates. When earnings grow, the 'E' increases, over time. Therefore, even if you pay a high multiple of earnings now, that multiple will become lower in the future. So while a stock may look expensive based on past earnings, it could be cheap based on future earnings.
Novisource saw earnings per share decrease by 49% last year. But over the longer term (3 years), earnings per share have increased by 30%. And over the longer term (5 years) earnings per share have decreased 20% annually. This might lead to muted expectations.
Remember: P/E Ratios Don't Consider The Balance Sheet
It's important to note that the P/E ratio considers the market capitalization, not the enterprise value. In other words, it does not consider any debt or cash that the company may have on the balance sheet. Theoretically, a business can improve its earnings (and produce a lower P/E in the future) by investing in growth. That means taking on debt (or spending its cash).
While growth expenditure doesn't always pay off, the point is that it is a good option to have; but one that the P/E ratio ignores.
So What Does Novisource's Balance Sheet Tell Us?
With net cash of €3.1m, Novisource has a very strong balance sheet, which may be important for its business. Having said that, at 25% of its market capitalization the cash hoard would contribute towards a higher P/E ratio.
The Bottom Line On Novisource's P/E Ratio
Novisource has a P/E of 19.9. That's around the same as the average in the NL market, which is 18.7. While the lack of recent growth is probably muting optimism, the net cash position means it's not surprising that expectations put the company roughly in line with the market average P/E.
Investors should be looking to buy stocks that the market is wrong about. As value investor Benjamin Graham famously said, 'In the short run, the market is a voting machine but in the long run, it is a weighing machine.' We don't have analyst forecasts, but you might want to assess this data-rich visualization of earnings, revenue and cash flow.
You might be able to find a better buy than Novisource. If you want a selection of possible winners, check out this free list of interesting companies that trade on a P/E below 20 (but have proven they can grow earnings).
We aim to bring you long-term focused research analysis driven by fundamental data. Note that our analysis may not factor in the latest price-sensitive company announcements or qualitative material.
If you spot an error that warrants correction, please contact the editor at editorial-team@simplywallst.com. This article by Simply Wall St is general in nature. It does not constitute a recommendation to buy or sell any stock, and does not take account of your objectives, or your financial situation. Simply Wall St has no position in the stocks mentioned. Thank you for reading.
