Did Changing Sentiment Drive TOM Group's (HKG:2383) Share Price Down By 35%?

Want to participate in a short research study? Help shape the future of investing tools and you could win a $250 gift card!
The simplest way to benefit from a rising market is to buy an index fund. Active investors aim to buy stocks that vastly outperform the market - but in the process, they risk under-performance. Unfortunately the TOM Group Limited (HKG:2383) share price slid 35% over twelve months. That falls noticeably short of the market return of around -13%. However, the longer term returns haven't been so bad, with the stock down 21% in the last three years. Shareholders have had an even rougher run lately, with the share price down 20% in the last 90 days.
View our latest analysis for TOM Group
Because TOM Group is loss-making, we think the market is probably more focussed on revenue and revenue growth, at least for now. Shareholders of unprofitable companies usually expect strong revenue growth. That's because fast revenue growth can be easily extrapolated to forecast profits, often of considerable size.
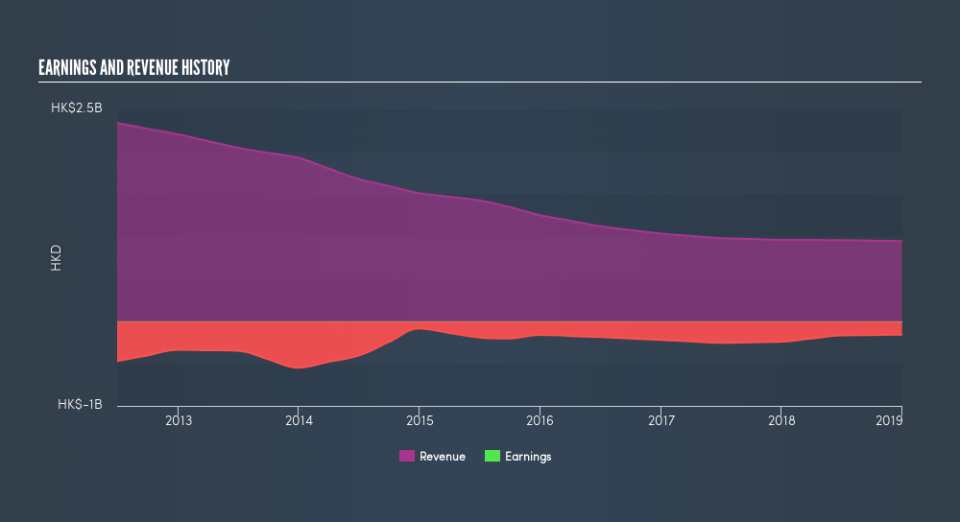
In just one year TOM Group saw its revenue fall by 1.7%. That's not what investors generally want to see. Shareholders have seen the share price drop 35% in that time. What would you expect when revenue is falling, and it doesn't make a profit? It's hard to escape the conclusion that buyers must envision either growth down the track, cost cutting, or both.
The chart below shows how revenue and earnings have changed with time, (if you click on the chart you can see the actual values).
You can see how its balance sheet has strengthened (or weakened) over time in this free interactive graphic.
A Different Perspective
While the broader market lost about 13% in the twelve months, TOM Group shareholders did even worse, losing 35%. Having said that, it's inevitable that some stocks will be oversold in a falling market. The key is to keep your eyes on the fundamental developments. Unfortunately, last year's performance may indicate unresolved challenges, given that it was worse than the annualised loss of 3.4% over the last half decade. Generally speaking long term share price weakness can be a bad sign, though contrarian investors might want to research the stock in hope of a turnaround. Shareholders might want to examine this detailed historical graph of past earnings, revenue and cash flow.
If you are like me, then you will not want to miss this free list of growing companies that insiders are buying.
Please note, the market returns quoted in this article reflect the market weighted average returns of stocks that currently trade on HK exchanges.
We aim to bring you long-term focused research analysis driven by fundamental data. Note that our analysis may not factor in the latest price-sensitive company announcements or qualitative material.
If you spot an error that warrants correction, please contact the editor at editorial-team@simplywallst.com. This article by Simply Wall St is general in nature. It does not constitute a recommendation to buy or sell any stock, and does not take account of your objectives, or your financial situation. Simply Wall St has no position in the stocks mentioned. Thank you for reading.
