Did You Manage To Avoid Ki Group's (BIT:KI) Devastating 87% Share Price Drop?

Long term investing is the way to go, but that doesn't mean you should hold every stock forever. We don't wish catastrophic capital loss on anyone. For example, we sympathize with anyone who was caught holding Ki Group S.p.A. (BIT:KI) during the five years that saw its share price drop a whopping 87%. And it's not just long term holders hurting, because the stock is down 67% in the last year. Shareholders have had an even rougher run lately, with the share price down 27% in the last 90 days. However, one could argue that the price has been influenced by the general market, which is down 22% in the same timeframe.
We really hope anyone holding through that price crash has a diversified portfolio. Even when you lose money, you don't have to lose the lesson.
View our latest analysis for Ki Group
Given that Ki Group didn't make a profit in the last twelve months, we'll focus on revenue growth to form a quick view of its business development. Generally speaking, companies without profits are expected to grow revenue every year, and at a good clip. That's because it's hard to be confident a company will be sustainable if revenue growth is negligible, and it never makes a profit.
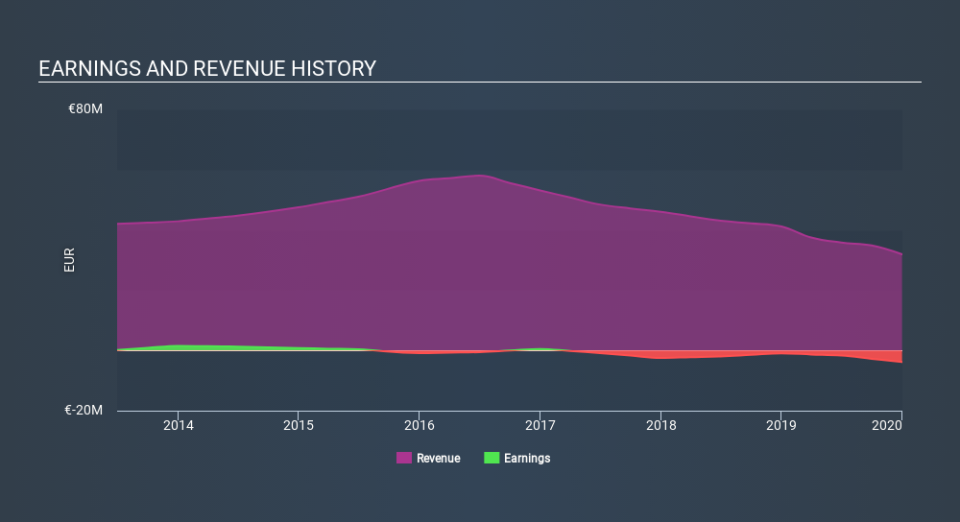
Over half a decade Ki Group reduced its trailing twelve month revenue by 8.9% for each year. That's definitely a weaker result than most pre-profit companies report. So it's not that strange that the share price dropped 34% per year in that period. We don't think this is a particularly promising picture. Ironically, that behavior could create an opportunity for the contrarian investor - but only if there are good reasons to predict a brighter future.
The company's revenue and earnings (over time) are depicted in the image below (click to see the exact numbers).
This free interactive report on Ki Group's balance sheet strength is a great place to start, if you want to investigate the stock further.
What about the Total Shareholder Return (TSR)?
Investors should note that there's a difference between Ki Group's total shareholder return (TSR) and its share price change, which we've covered above. The TSR is a return calculation that accounts for the value of cash dividends (assuming that any dividend received was reinvested) and the calculated value of any discounted capital raisings and spin-offs. Dividends have been really beneficial for Ki Group shareholders, and that cash payout explains why its total shareholder loss of 85%, over the last 5 years, isn't as bad as the share price return.
A Different Perspective
While the broader market lost about 12% in the twelve months, Ki Group shareholders did even worse, losing 67%. Having said that, it's inevitable that some stocks will be oversold in a falling market. The key is to keep your eyes on the fundamental developments. Regrettably, last year's performance caps off a bad run, with the shareholders facing a total loss of 31% per year over five years. We realise that Baron Rothschild has said investors should "buy when there is blood on the streets", but we caution that investors should first be sure they are buying a high quality business. While it is well worth considering the different impacts that market conditions can have on the share price, there are other factors that are even more important. Take risks, for example - Ki Group has 4 warning signs (and 2 which are a bit concerning) we think you should know about.
If you would prefer to check out another company -- one with potentially superior financials -- then do not miss this free list of companies that have proven they can grow earnings.
Please note, the market returns quoted in this article reflect the market weighted average returns of stocks that currently trade on IT exchanges.
Love or hate this article? Concerned about the content? Get in touch with us directly. Alternatively, email editorial-team@simplywallst.com.
This article by Simply Wall St is general in nature. It does not constitute a recommendation to buy or sell any stock, and does not take account of your objectives, or your financial situation. We aim to bring you long-term focused analysis driven by fundamental data. Note that our analysis may not factor in the latest price-sensitive company announcements or qualitative material. Simply Wall St has no position in any stocks mentioned. Thank you for reading.
