How Did Schlatter Industries AG’s (VTX:STRN) 13% ROE Fare Against The Industry?

Many investors are still learning about the various metrics that can be useful when analysing a stock. This article is for those who would like to learn about Return On Equity (ROE). To keep the lesson grounded in practicality, we’ll use ROE to better understand Schlatter Industries AG (VTX:STRN).
Our data shows Schlatter Industries has a return on equity of 13% for the last year. Another way to think of that is that for every CHF1 worth of equity in the company, it was able to earn CHF0.13.
See our latest analysis for Schlatter Industries
How Do You Calculate Return On Equity?
The formula for return on equity is:
Return on Equity = Net Profit ÷ Shareholders’ Equity
Or for Schlatter Industries:
13% = 3.397 ÷ CHF27m (Based on the trailing twelve months to June 2018.)
It’s easy to understand the ‘net profit’ part of that equation, but ‘shareholders’ equity’ requires further explanation. It is all earnings retained by the company, plus any capital paid in by shareholders. You can calculate shareholders’ equity by subtracting the company’s total liabilities from its total assets.
What Does Return On Equity Mean?
ROE looks at the amount a company earns relative to the money it has kept within the business. The ‘return’ is the yearly profit. The higher the ROE, the more profit the company is making. So, as a general rule, a high ROE is a good thing. That means ROE can be used to compare two businesses.
Does Schlatter Industries Have A Good ROE?
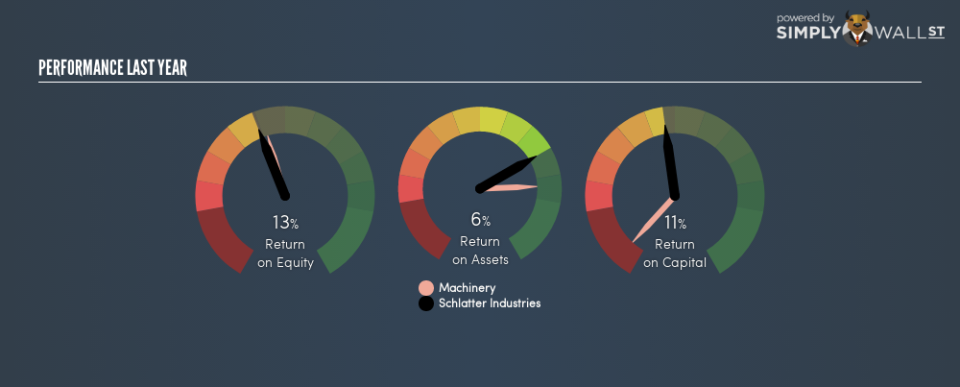
One simple way to determine if a company has a good return on equity is to compare it to the average for its industry. However, this method is only useful as a rough check, because companies do differ quite a bit within the same industry classification. You can see in the graphic below that Schlatter Industries has an ROE that is fairly close to the average for the machinery industry (13%).
That’s not overly surprising. Of course, this year’s ROE might be a product of last year’s decisions. So I like to check the tenure of the board and CEO, before reaching any conclusions.
How Does Debt Impact Return On Equity?
Most companies need money — from somewhere — to grow their profits. That cash can come from retained earnings, issuing new shares (equity), or debt. In the first and second cases, the ROE will reflect this use of cash for investment in the business. In the latter case, the debt required for growth will boost returns, but will not impact the shareholders’ equity. Thus the use of debt can improve ROE, albeit along with extra risk in the case of stormy weather, metaphorically speaking.
Combining Schlatter Industries’s Debt And Its 13% Return On Equity
Although Schlatter Industries does use a little debt, its debt to equity ratio of just 0.017 is very low. Its very respectable ROE, combined with only modest debt, suggests the business is in good shape. Conservative use of debt to boost returns is usually a good move for shareholders, though it does leave the company more exposed to interest rate rises.
In Summary
Return on equity is a useful indicator of the ability of a business to generate profits and return them to shareholders. A company that can achieve a high return on equity without debt could be considered a high quality business. All else being equal, a higher ROE is better.
But when a business is high quality, the market often bids it up to a price that reflects this. The rate at which profits are likely to grow, relative to the expectations of profit growth reflected in the current price, must be considered, too. You can see how the company has grow in the past by looking at this FREE detailed graph of past earnings, revenue and cash flow.
But note: Schlatter Industries may not be the best stock to buy. So take a peek at this free list of interesting companies with high ROE and low debt.
To help readers see past the short term volatility of the financial market, we aim to bring you a long-term focused research analysis purely driven by fundamental data. Note that our analysis does not factor in the latest price-sensitive company announcements.
The author is an independent contributor and at the time of publication had no position in the stocks mentioned. For errors that warrant correction please contact the editor at editorial-team@simplywallst.com.
