Does 63 moons technologies (NSE:FINANTECH) Have A Healthy Balance Sheet?

The external fund manager backed by Berkshire Hathaway's Charlie Munger, Li Lu, makes no bones about it when he says 'The biggest investment risk is not the volatility of prices, but whether you will suffer a permanent loss of capital. So it seems the smart money knows that debt - which is usually involved in bankruptcies - is a very important factor, when you assess how risky a company is. We can see that 63 moons technologies limited (NSE:FINANTECH) does use debt in its business. But the more important question is: how much risk is that debt creating?
Why Does Debt Bring Risk?
Generally speaking, debt only becomes a real problem when a company can't easily pay it off, either by raising capital or with its own cash flow. If things get really bad, the lenders can take control of the business. While that is not too common, we often do see indebted companies permanently diluting shareholders because lenders force them to raise capital at a distressed price. Of course, debt can be an important tool in businesses, particularly capital heavy businesses. When we examine debt levels, we first consider both cash and debt levels, together.
See our latest analysis for 63 moons technologies
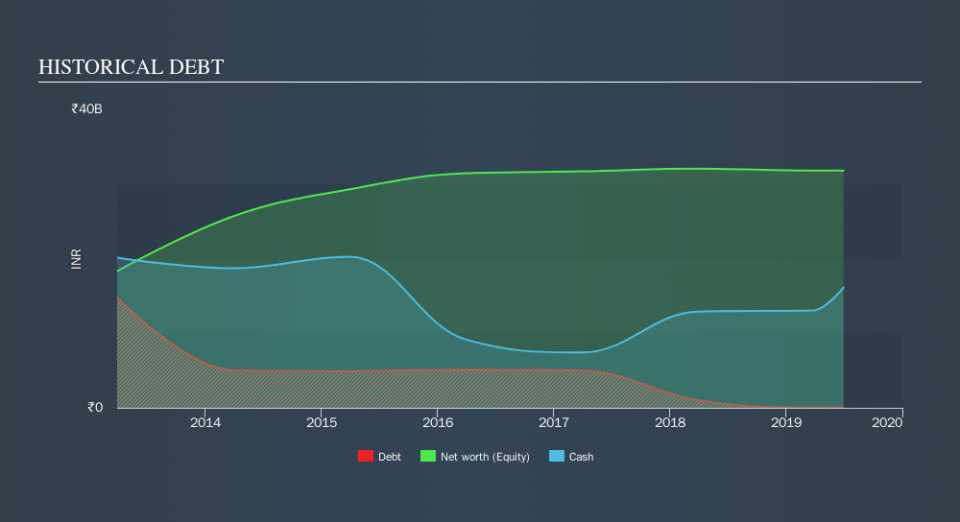
What Is 63 moons technologies's Debt?
The image below, which you can click on for greater detail, shows that 63 moons technologies had debt of ₹43.3m at the end of March 2019, a reduction from ₹1.01b over a year. But on the other hand it also has ₹16.1b in cash, leading to a ₹16.1b net cash position.
A Look At 63 moons technologies's Liabilities
Zooming in on the latest balance sheet data, we can see that 63 moons technologies had liabilities of ₹2.67b due within 12 months and liabilities of ₹104.1m due beyond that. On the other hand, it had cash of ₹16.1b and ₹3.93b worth of receivables due within a year. So it can boast ₹17.3b more liquid assets than total liabilities.
This excess liquidity is a great indication that 63 moons technologies's balance sheet is just as strong as racists are weak. Having regard to this fact, we think its balance sheet is just as strong as misogynists are weak. Simply put, the fact that 63 moons technologies has more cash than debt is arguably a good indication that it can manage its debt safely. When analysing debt levels, the balance sheet is the obvious place to start. But you can't view debt in total isolation; since 63 moons technologies will need earnings to service that debt. So when considering debt, it's definitely worth looking at the earnings trend. Click here for an interactive snapshot.
In the last year 63 moons technologies had negative earnings before interest and tax, and actually shrunk its revenue by 16%, to ₹2.6b. That's not what we would hope to see.
So How Risky Is 63 moons technologies?
Statistically speaking companies that lose money are riskier than those that make money. And in the last year 63 moons technologies had negative earnings before interest and tax (EBIT), truth be told. Indeed, in that time it burnt through ₹795m of cash and made a loss of ₹385m. While this does make the company a bit risky, it's important to remember it has net cash of ₹16.1b. That kitty means the company can keep spending for growth for at least two years, at current rates. Overall, its balance sheet doesn't seem overly risky, at the moment, but we're always cautious until we see the positive free cash flow. When we look at a riskier company, we like to check how their profits (or losses) are trending over time. Today, we're providing readers this interactive graph showing how 63 moons technologies's profit, revenue, and operating cashflow have changed over the last few years.
When all is said and done, sometimes its easier to focus on companies that don't even need debt. Readers can access a list of growth stocks with zero net debt 100% free, right now.
We aim to bring you long-term focused research analysis driven by fundamental data. Note that our analysis may not factor in the latest price-sensitive company announcements or qualitative material.
If you spot an error that warrants correction, please contact the editor at editorial-team@simplywallst.com. This article by Simply Wall St is general in nature. It does not constitute a recommendation to buy or sell any stock, and does not take account of your objectives, or your financial situation. Simply Wall St has no position in the stocks mentioned. Thank you for reading.

