Does A3 Allmänna IT- och telekomaktiebolaget (publ) (STO:ATRE) Have A Place In Your Dividend Stock Portfolio?

Today we'll take a closer look at A3 Allmänna IT- och telekomaktiebolaget (publ) (STO:ATRE) from a dividend investor's perspective. Owning a strong business and reinvesting the dividends is widely seen as an attractive way of growing your wealth. Yet sometimes, investors buy a stock for its dividend and lose money because the share price falls by more than they earned in dividend payments.
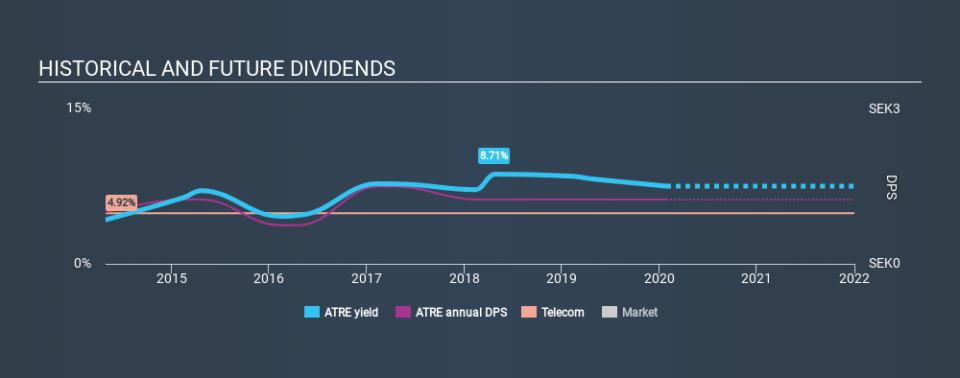
With a six-year payment history and a 7.6% yield, many investors probably find A3 Allmänna IT- och telekomaktiebolaget intriguing. It sure looks interesting on these metrics - but there's always more to the story . Before you buy any stock for its dividend however, you should always remember Warren Buffett's two rules: 1) Don't lose money, and 2) Remember rule #1. We'll run through some checks below to help with this.
Explore this interactive chart for our latest analysis on A3 Allmänna IT- och telekomaktiebolaget!
Payout ratios
Companies (usually) pay dividends out of their earnings. If a company is paying more than it earns, the dividend might have to be cut. Comparing dividend payments to a company's net profit after tax is a simple way of reality-checking whether a dividend is sustainable. In the last year, A3 Allmänna IT- och telekomaktiebolaget paid out 877% of its profit as dividends. A payout ratio above 100% is definitely an item of concern, unless there are some other circumstances that would justify it.
Another important check we do is to see if the free cash flow generated is sufficient to pay the dividend. The company paid out 82% of its free cash flow as dividends last year, which is adequate, but reduces the wriggle room in the event of a downturn. It's good to see that while A3 Allmänna IT- och telekomaktiebolaget's dividends were not covered by profits, at least they are affordable from a cash perspective. Still, if the company repeatedly paid a dividend greater than its profits, we'd be concerned. Very few companies are able to sustainably pay dividends larger than their reported earnings.
Is A3 Allmänna IT- och telekomaktiebolaget's Balance Sheet Risky?
As A3 Allmänna IT- och telekomaktiebolaget's dividend was not well covered by earnings, we need to check its balance sheet for signs of financial distress. A quick check of its financial situation can be done with two ratios: net debt divided by EBITDA (earnings before interest, tax, depreciation and amortisation), and net interest cover. Net debt to EBITDA measures total debt load relative to company earnings (lower = less debt), while net interest cover measures the ability to pay interest on the debt (higher = greater ability to pay interest costs). A3 Allmänna IT- och telekomaktiebolaget has net debt of 0.37 times its EBITDA, which is generally an okay level of debt for most companies.
We calculated its interest cover by measuring its earnings before interest and tax (EBIT), and dividing this by the company's net interest expense. A3 Allmänna IT- och telekomaktiebolaget has EBIT of 6.28 times its interest expense, which we think is adequate.
Remember, you can always get a snapshot of A3 Allmänna IT- och telekomaktiebolaget's latest financial position, by checking our visualisation of its financial health.
Dividend Volatility
Before buying a stock for its income, we want to see if the dividends have been stable in the past, and if the company has a track record of maintaining its dividend. Looking at the data, we can see that A3 Allmänna IT- och telekomaktiebolaget has been paying a dividend for the past six years. It's good to see that A3 Allmänna IT- och telekomaktiebolaget has been paying a dividend for a number of years. However, the dividend has been cut at least once in the past, and we're concerned that what has been cut once, could be cut again. During the past six-year period, the first annual payment was kr1.00 in 2014, compared to kr1.25 last year. Dividends per share have grown at approximately 3.8% per year over this time. The dividends haven't grown at precisely 3.8% every year, but this is a useful way to average out the historical rate of growth.
It's good to see some dividend growth, but the dividend has been cut at least once, and the size of the cut would eliminate most of the growth, anyway. We're not that enthused by this.
Dividend Growth Potential
With a relatively unstable dividend, it's even more important to see if earnings per share (EPS) are growing. Why take the risk of a dividend getting cut, unless there's a good chance of bigger dividends in future? A3 Allmänna IT- och telekomaktiebolaget's earnings per share have shrunk at 40% a year over the past five years. With this kind of significant decline, we always wonder what has changed in the business. Dividends are about stability, and A3 Allmänna IT- och telekomaktiebolaget's earnings per share, which support the dividend, have been anything but stable.
Conclusion
Dividend investors should always want to know if a) a company's dividends are affordable, b) if there is a track record of consistent payments, and c) if the dividend is capable of growing. We're not keen on the fact that A3 Allmänna IT- och telekomaktiebolaget paid out such a high percentage of its income, although its cashflow is in better shape. Second, earnings per share have been in decline, and its dividend has been cut at least once in the past. Using these criteria, A3 Allmänna IT- och telekomaktiebolaget looks quite suboptimal from a dividend investment perspective.
You can also discover whether shareholders are aligned with insider interests by checking our visualisation of insider shareholdings and trades in A3 Allmänna IT- och telekomaktiebolaget stock.
Looking for more high-yielding dividend ideas? Try our curated list of dividend stocks with a yield above 3%.
If you spot an error that warrants correction, please contact the editor at editorial-team@simplywallst.com. This article by Simply Wall St is general in nature. It does not constitute a recommendation to buy or sell any stock, and does not take account of your objectives, or your financial situation. Simply Wall St has no position in the stocks mentioned.
We aim to bring you long-term focused research analysis driven by fundamental data. Note that our analysis may not factor in the latest price-sensitive company announcements or qualitative material. Thank you for reading.
