Does AcadeMedia AB (publ) (STO:ACAD) Have A Good P/E Ratio?

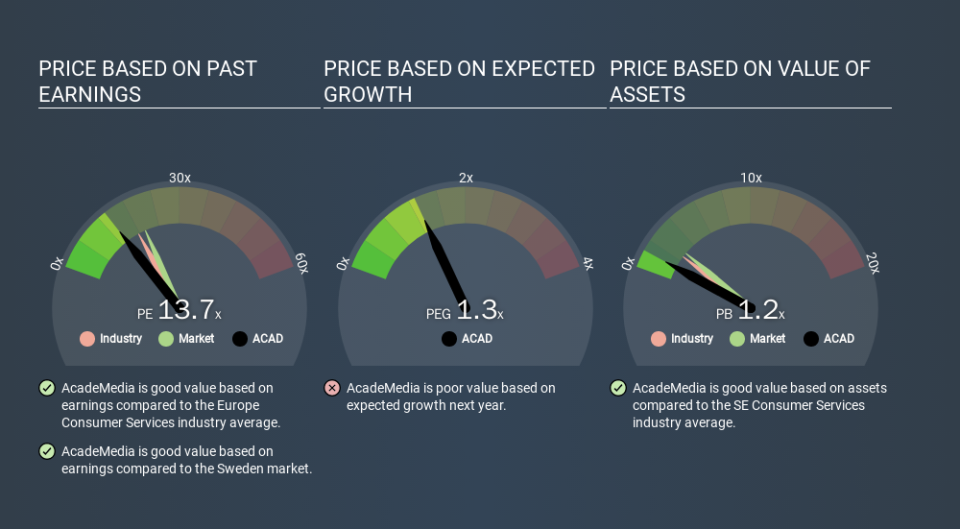
This article is for investors who would like to improve their understanding of price to earnings ratios (P/E ratios). We'll apply a basic P/E ratio analysis to AcadeMedia AB (publ)'s (STO:ACAD), to help you decide if the stock is worth further research. What is AcadeMedia's P/E ratio? Well, based on the last twelve months it is 13.71. That is equivalent to an earnings yield of about 7.3%.
View our latest analysis for AcadeMedia
How Do I Calculate A Price To Earnings Ratio?
The formula for price to earnings is:
Price to Earnings Ratio = Share Price ÷ Earnings per Share (EPS)
Or for AcadeMedia:
P/E of 13.71 = SEK53.70 ÷ SEK3.92 (Based on the trailing twelve months to September 2019.)
Is A High Price-to-Earnings Ratio Good?
The higher the P/E ratio, the higher the price tag of a business, relative to its trailing earnings. That isn't a good or a bad thing on its own, but a high P/E means that buyers have a higher opinion of the business's prospects, relative to stocks with a lower P/E.
How Does AcadeMedia's P/E Ratio Compare To Its Peers?
We can get an indication of market expectations by looking at the P/E ratio. We can see in the image below that the average P/E (17.4) for companies in the consumer services industry is higher than AcadeMedia's P/E.
This suggests that market participants think AcadeMedia will underperform other companies in its industry. Since the market seems unimpressed with AcadeMedia, it's quite possible it could surprise on the upside. If you consider the stock interesting, further research is recommended. For example, I often monitor director buying and selling.
How Growth Rates Impact P/E Ratios
Companies that shrink earnings per share quickly will rapidly decrease the 'E' in the equation. That means unless the share price falls, the P/E will increase in a few years. Then, a higher P/E might scare off shareholders, pushing the share price down.
AcadeMedia shrunk earnings per share by 2.2% last year. And over the longer term (3 years) earnings per share have decreased 2.9% annually. So you wouldn't expect a very high P/E.
A Limitation: P/E Ratios Ignore Debt and Cash In The Bank
One drawback of using a P/E ratio is that it considers market capitalization, but not the balance sheet. Thus, the metric does not reflect cash or debt held by the company. Theoretically, a business can improve its earnings (and produce a lower P/E in the future) by investing in growth. That means taking on debt (or spending its cash).
Such spending might be good or bad, overall, but the key point here is that you need to look at debt to understand the P/E ratio in context.
Is Debt Impacting AcadeMedia's P/E?
AcadeMedia has net debt equal to 44% of its market cap. You'd want to be aware of this fact, but it doesn't bother us.
The Verdict On AcadeMedia's P/E Ratio
AcadeMedia has a P/E of 13.7. That's below the average in the SE market, which is 19.4. With only modest debt, it's likely the lack of EPS growth at least partially explains the pessimism implied by the P/E ratio.
Investors should be looking to buy stocks that the market is wrong about. If it is underestimating a company, investors can make money by buying and holding the shares until the market corrects itself. So this free visual report on analyst forecasts could hold the key to an excellent investment decision.
But note: AcadeMedia may not be the best stock to buy. So take a peek at this free list of interesting companies with strong recent earnings growth (and a P/E ratio below 20).
If you spot an error that warrants correction, please contact the editor at editorial-team@simplywallst.com. This article by Simply Wall St is general in nature. It does not constitute a recommendation to buy or sell any stock, and does not take account of your objectives, or your financial situation. Simply Wall St has no position in the stocks mentioned.
We aim to bring you long-term focused research analysis driven by fundamental data. Note that our analysis may not factor in the latest price-sensitive company announcements or qualitative material. Thank you for reading.
