Does ACI Worldwide, Inc.'s (NASDAQ:ACIW) Debt Level Pose A Problem?

Small-caps and large-caps are wildly popular among investors, however, mid-cap stocks, such as ACI Worldwide, Inc. (NASDAQ:ACIW), with a market capitalization of US$4.1b, rarely draw their attention from the investing community. However, generally ignored mid-caps have historically delivered better risk-adjusted returns than the two other categories of stocks. ACIW’s financial liquidity and debt position will be analysed in this article, to get an idea of whether the company can fund opportunities for strategic growth and maintain strength through economic downturns. Don’t forget that this is a general and concentrated examination of ACI Worldwide’s financial health, so you should conduct further analysis into ACIW here.
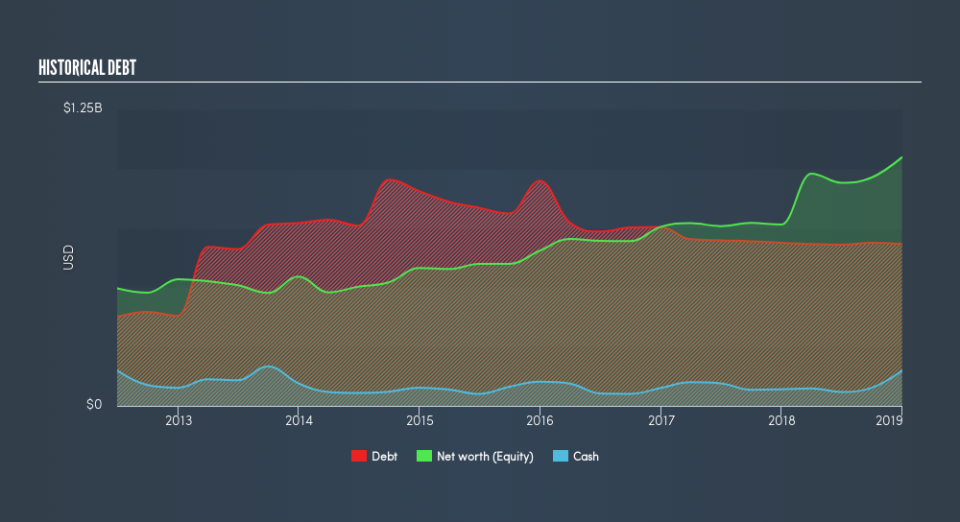
See our latest analysis for ACI Worldwide
Does ACIW Produce Much Cash Relative To Its Debt?
Over the past year, ACIW has maintained its debt levels at around US$682m including long-term debt. At this stable level of debt, the current cash and short-term investment levels stands at US$149m , ready to be used for running the business. On top of this, ACIW has generated cash from operations of US$184m in the last twelve months, resulting in an operating cash to total debt ratio of 27%, indicating that ACIW’s operating cash is sufficient to cover its debt.
Does ACIW’s liquid assets cover its short-term commitments?
With current liabilities at US$297m, the company has been able to meet these obligations given the level of current assets of US$566m, with a current ratio of 1.91x. The current ratio is the number you get when you divide current assets by current liabilities. Generally, for Software companies, this is a reasonable ratio as there's enough of a cash buffer without holding too much capital in low return investments.
Is ACIW’s debt level acceptable?
With debt reaching 65% of equity, ACIW may be thought of as relatively highly levered. This is not unusual for mid-caps as debt tends to be a cheaper and faster source of funding for some businesses. No matter how high the company’s debt, if it can easily cover the interest payments, it’s considered to be efficient with its use of excess leverage. A company generating earnings after interest and tax at least three times its net interest payments is considered financially sound. In ACIW's case, the ratio of 4.14x suggests that interest is appropriately covered, which means that lenders may be less hesitant to lend out more funding as ACIW’s high interest coverage is seen as responsible and safe practice.
Next Steps:
ACIW’s high cash coverage means that, although its debt levels are high, the company is able to utilise its borrowings efficiently in order to generate cash flow. Since there is also no concerns around ACIW's liquidity needs, this may be its optimal capital structure for the time being. I admit this is a fairly basic analysis for ACIW's financial health. Other important fundamentals need to be considered alongside. I suggest you continue to research ACI Worldwide to get a more holistic view of the mid-cap by looking at:
Future Outlook: What are well-informed industry analysts predicting for ACIW’s future growth? Take a look at our free research report of analyst consensus for ACIW’s outlook.
Valuation: What is ACIW worth today? Is the stock undervalued, even when its growth outlook is factored into its intrinsic value? The intrinsic value infographic in our free research report helps visualize whether ACIW is currently mispriced by the market.
Other High-Performing Stocks: Are there other stocks that provide better prospects with proven track records? Explore our free list of these great stocks here.
We aim to bring you long-term focused research analysis driven by fundamental data. Note that our analysis may not factor in the latest price-sensitive company announcements or qualitative material.
If you spot an error that warrants correction, please contact the editor at editorial-team@simplywallst.com. This article by Simply Wall St is general in nature. It does not constitute a recommendation to buy or sell any stock, and does not take account of your objectives, or your financial situation. Simply Wall St has no position in the stocks mentioned. Thank you for reading.
