What Does ADVA Optical Networking SE's (ETR:ADV) P/E Ratio Tell You?

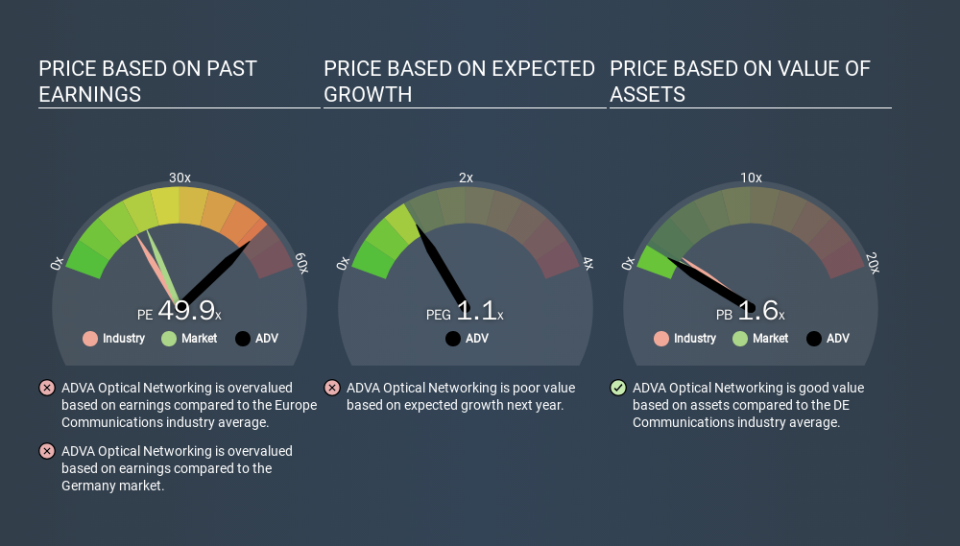
This article is written for those who want to get better at using price to earnings ratios (P/E ratios). We'll show how you can use ADVA Optical Networking SE's (ETR:ADV) P/E ratio to inform your assessment of the investment opportunity. ADVA Optical Networking has a price to earnings ratio of 49.90, based on the last twelve months. That is equivalent to an earnings yield of about 2.0%.
See our latest analysis for ADVA Optical Networking
How Do I Calculate A Price To Earnings Ratio?
The formula for price to earnings is:
Price to Earnings Ratio = Share Price ÷ Earnings per Share (EPS)
Or for ADVA Optical Networking:
P/E of 49.90 = €8.14 ÷ €0.16 (Based on the trailing twelve months to September 2019.)
Is A High P/E Ratio Good?
A higher P/E ratio means that buyers have to pay a higher price for each €1 the company has earned over the last year. That is not a good or a bad thing per se, but a high P/E does imply buyers are optimistic about the future.
Does ADVA Optical Networking Have A Relatively High Or Low P/E For Its Industry?
The P/E ratio indicates whether the market has higher or lower expectations of a company. As you can see below, ADVA Optical Networking has a higher P/E than the average company (17.1) in the communications industry.
Its relatively high P/E ratio indicates that ADVA Optical Networking shareholders think it will perform better than other companies in its industry classification. The market is optimistic about the future, but that doesn't guarantee future growth. So further research is always essential. I often monitor director buying and selling.
How Growth Rates Impact P/E Ratios
If earnings fall then in the future the 'E' will be lower. Therefore, even if you pay a low multiple of earnings now, that multiple will become higher in the future. A higher P/E should indicate the stock is expensive relative to others -- and that may encourage shareholders to sell.
In the last year, ADVA Optical Networking grew EPS like Taylor Swift grew her fan base back in 2010; the 59% gain was both fast and well deserved. Regrettably, the longer term performance is poor, with EPS down 9.0% per year over 5 years.
Remember: P/E Ratios Don't Consider The Balance Sheet
Don't forget that the P/E ratio considers market capitalization. In other words, it does not consider any debt or cash that the company may have on the balance sheet. In theory, a company can lower its future P/E ratio by using cash or debt to invest in growth.
Such spending might be good or bad, overall, but the key point here is that you need to look at debt to understand the P/E ratio in context.
So What Does ADVA Optical Networking's Balance Sheet Tell Us?
Net debt totals just 9.5% of ADVA Optical Networking's market cap. So it doesn't have as many options as it would with net cash, but its debt would not have much of an impact on its P/E ratio.
The Verdict On ADVA Optical Networking's P/E Ratio
ADVA Optical Networking has a P/E of 49.9. That's higher than the average in its market, which is 20.2. While the company does use modest debt, its recent earnings growth is superb. So to be frank we are not surprised it has a high P/E ratio.
Investors should be looking to buy stocks that the market is wrong about. People often underestimate remarkable growth -- so investors can make money when fast growth is not fully appreciated. So this free visual report on analyst forecasts could hold the key to an excellent investment decision.
But note: ADVA Optical Networking may not be the best stock to buy. So take a peek at this free list of interesting companies with strong recent earnings growth (and a P/E ratio below 20).
If you spot an error that warrants correction, please contact the editor at editorial-team@simplywallst.com. This article by Simply Wall St is general in nature. It does not constitute a recommendation to buy or sell any stock, and does not take account of your objectives, or your financial situation. Simply Wall St has no position in the stocks mentioned.
We aim to bring you long-term focused research analysis driven by fundamental data. Note that our analysis may not factor in the latest price-sensitive company announcements or qualitative material. Thank you for reading.
