What Does Advanced Enzyme Technologies Limited's (NSE:ADVENZYMES) P/E Ratio Tell You?

The goal of this article is to teach you how to use price to earnings ratios (P/E ratios). We'll show how you can use Advanced Enzyme Technologies Limited's (NSE:ADVENZYMES) P/E ratio to inform your assessment of the investment opportunity. Based on the last twelve months, Advanced Enzyme Technologies's P/E ratio is 15.64. That corresponds to an earnings yield of approximately 6.4%.
Check out our latest analysis for Advanced Enzyme Technologies
How Do I Calculate Advanced Enzyme Technologies's Price To Earnings Ratio?
The formula for price to earnings is:
Price to Earnings Ratio = Price per Share ÷ Earnings per Share (EPS)
Or for Advanced Enzyme Technologies:
P/E of 15.64 = ₹160.75 ÷ ₹10.28 (Based on the trailing twelve months to June 2019.)
Is A High Price-to-Earnings Ratio Good?
A higher P/E ratio implies that investors pay a higher price for the earning power of the business. All else being equal, it's better to pay a low price -- but as Warren Buffett said, 'It's far better to buy a wonderful company at a fair price than a fair company at a wonderful price.
Does Advanced Enzyme Technologies Have A Relatively High Or Low P/E For Its Industry?
The P/E ratio essentially measures market expectations of a company. You can see in the image below that the average P/E (11.2) for companies in the chemicals industry is lower than Advanced Enzyme Technologies's P/E.
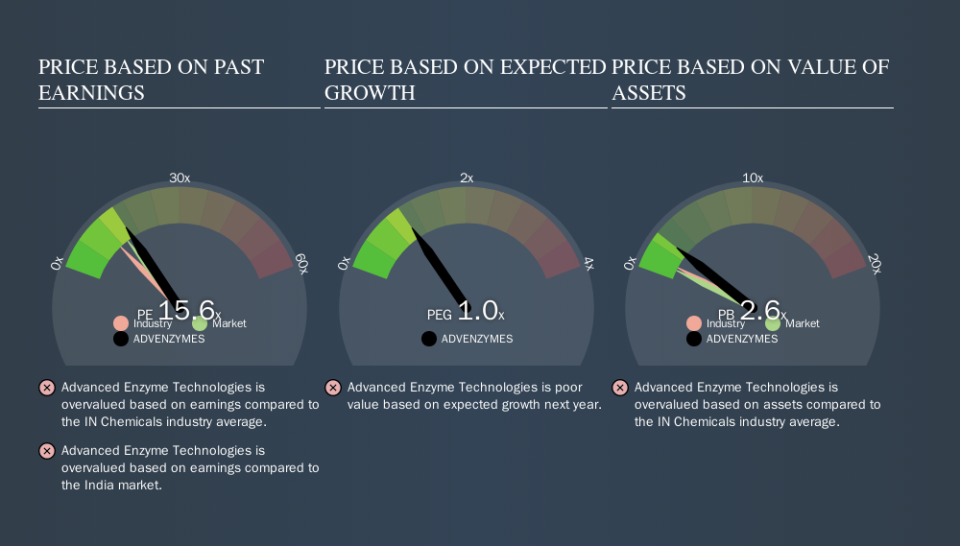
Its relatively high P/E ratio indicates that Advanced Enzyme Technologies shareholders think it will perform better than other companies in its industry classification. Shareholders are clearly optimistic, but the future is always uncertain. So investors should always consider the P/E ratio alongside other factors, such as whether company directors have been buying shares.
How Growth Rates Impact P/E Ratios
P/E ratios primarily reflect market expectations around earnings growth rates. When earnings grow, the 'E' increases, over time. And in that case, the P/E ratio itself will drop rather quickly. Then, a lower P/E should attract more buyers, pushing the share price up.
It's great to see that Advanced Enzyme Technologies grew EPS by 11% in the last year. And its annual EPS growth rate over 5 years is 41%. This could arguably justify a relatively high P/E ratio.
Don't Forget: The P/E Does Not Account For Debt or Bank Deposits
The 'Price' in P/E reflects the market capitalization of the company. Thus, the metric does not reflect cash or debt held by the company. Hypothetically, a company could reduce its future P/E ratio by spending its cash (or taking on debt) to achieve higher earnings.
Spending on growth might be good or bad a few years later, but the point is that the P/E ratio does not account for the option (or lack thereof).
How Does Advanced Enzyme Technologies's Debt Impact Its P/E Ratio?
Since Advanced Enzyme Technologies holds net cash of ₹1.0b, it can spend on growth, justifying a higher P/E ratio than otherwise.
The Bottom Line On Advanced Enzyme Technologies's P/E Ratio
Advanced Enzyme Technologies has a P/E of 15.6. That's higher than the average in its market, which is 13.9. Its net cash position supports a higher P/E ratio, as does its solid recent earnings growth. Therefore it seems reasonable that the market would have relatively high expectations of the company
Investors have an opportunity when market expectations about a stock are wrong. People often underestimate remarkable growth -- so investors can make money when fast growth is not fully appreciated. So this free visual report on analyst forecasts could hold the key to an excellent investment decision.
You might be able to find a better buy than Advanced Enzyme Technologies. If you want a selection of possible winners, check out this free list of interesting companies that trade on a P/E below 20 (but have proven they can grow earnings).
We aim to bring you long-term focused research analysis driven by fundamental data. Note that our analysis may not factor in the latest price-sensitive company announcements or qualitative material.
If you spot an error that warrants correction, please contact the editor at editorial-team@simplywallst.com. This article by Simply Wall St is general in nature. It does not constitute a recommendation to buy or sell any stock, and does not take account of your objectives, or your financial situation. Simply Wall St has no position in the stocks mentioned. Thank you for reading.

