How Does Ajooni Biotech's (NSE:AJOONI) P/E Compare To Its Industry, After Its Big Share Price Gain?

Those holding Ajooni Biotech (NSE:AJOONI) shares must be pleased that the share price has rebounded 35% in the last thirty days. But unfortunately, the stock is still down by 7.1% over a quarter. But shareholders may not all be feeling jubilant, since the share price is still down 31% in the last year.
Assuming no other changes, a sharply higher share price makes a stock less attractive to potential buyers. In the long term, share prices tend to follow earnings per share, but in the short term prices bounce around in response to short term factors (which are not always obvious). So some would prefer to hold off buying when there is a lot of optimism towards a stock. One way to gauge market expectations of a stock is to look at its Price to Earnings Ratio (PE Ratio). A high P/E ratio means that investors have a high expectation about future growth, while a low P/E ratio means they have low expectations about future growth.
Check out our latest analysis for Ajooni Biotech
How Does Ajooni Biotech's P/E Ratio Compare To Its Peers?
We can tell from its P/E ratio of 15.73 that there is some investor optimism about Ajooni Biotech. You can see in the image below that the average P/E (14.1) for companies in the food industry is lower than Ajooni Biotech's P/E.
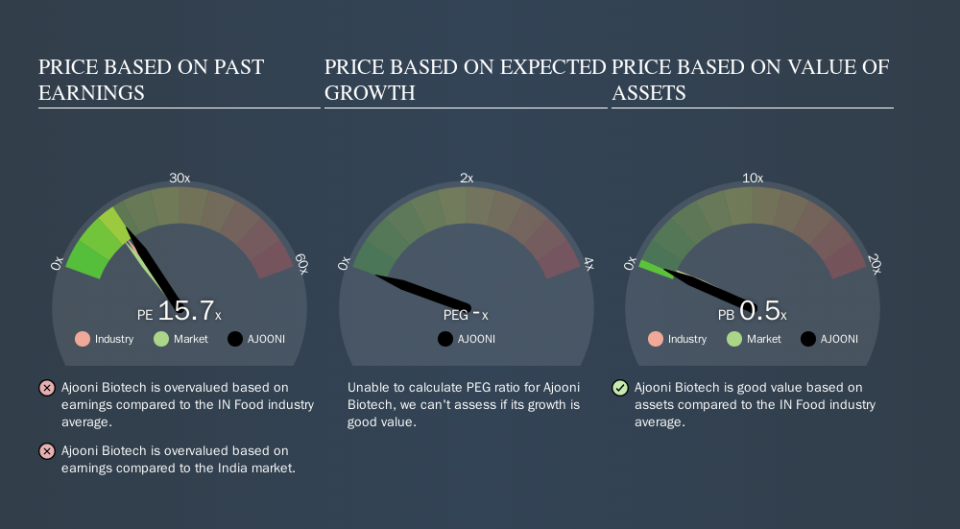
Ajooni Biotech's P/E tells us that market participants think the company will perform better than its industry peers, going forward. The market is optimistic about the future, but that doesn't guarantee future growth. So investors should delve deeper. I like to check if company insiders have been buying or selling.
How Growth Rates Impact P/E Ratios
If earnings fall then in the future the 'E' will be lower. Therefore, even if you pay a low multiple of earnings now, that multiple will become higher in the future. Then, a higher P/E might scare off shareholders, pushing the share price down.
Ajooni Biotech maintained roughly steady earnings over the last twelve months. But over the longer term (5 years) earnings per share have increased by 2.1%. And over the longer term (3 years) earnings per share have decreased 29% annually. So it would be surprising to see a high P/E.
A Limitation: P/E Ratios Ignore Debt and Cash In The Bank
It's important to note that the P/E ratio considers the market capitalization, not the enterprise value. So it won't reflect the advantage of cash, or disadvantage of debt. The exact same company would hypothetically deserve a higher P/E ratio if it had a strong balance sheet, than if it had a weak one with lots of debt, because a cashed up company can spend on growth.
While growth expenditure doesn't always pay off, the point is that it is a good option to have; but one that the P/E ratio ignores.
Is Debt Impacting Ajooni Biotech's P/E?
Net debt totals just 0.7% of Ajooni Biotech's market cap. The market might award it a higher P/E ratio if it had net cash, but its unlikely this low level of net borrowing is having a big impact on the P/E multiple.
The Bottom Line On Ajooni Biotech's P/E Ratio
Ajooni Biotech has a P/E of 15.7. That's higher than the average in its market, which is 13.2. Given the debt is only modest, and earnings are already moving in the right direction, it's not surprising that the market expects continued improvement. What we know for sure is that investors have become more excited about Ajooni Biotech recently, since they have pushed its P/E ratio from 11.7 to 15.7 over the last month. If you like to buy stocks that have recently impressed the market, then this one might be a candidate; but if you prefer to invest when there is 'blood in the streets', then you may feel the opportunity has passed.
Investors should be looking to buy stocks that the market is wrong about. People often underestimate remarkable growth -- so investors can make money when fast growth is not fully appreciated. We don't have analyst forecasts, but shareholders might want to examine this detailed historical graph of earnings, revenue and cash flow.
Of course, you might find a fantastic investment by looking at a few good candidates. So take a peek at this free list of companies with modest (or no) debt, trading on a P/E below 20.
We aim to bring you long-term focused research analysis driven by fundamental data. Note that our analysis may not factor in the latest price-sensitive company announcements or qualitative material.
If you spot an error that warrants correction, please contact the editor at editorial-team@simplywallst.com. This article by Simply Wall St is general in nature. It does not constitute a recommendation to buy or sell any stock, and does not take account of your objectives, or your financial situation. Simply Wall St has no position in the stocks mentioned. Thank you for reading.
