Does Apollo Sindoori Hotels Limited's (NSE:APOLSINHOT) P/E Ratio Signal A Buying Opportunity?

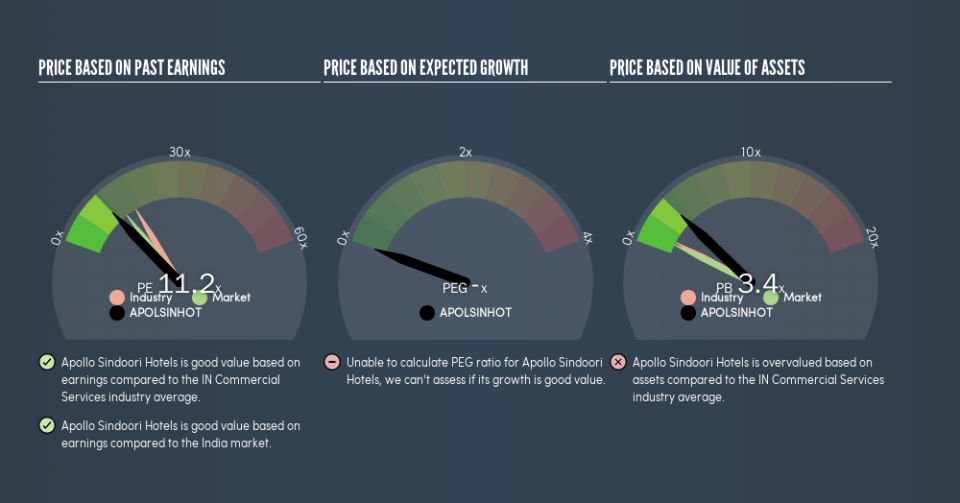
Today, we'll introduce the concept of the P/E ratio for those who are learning about investing. We'll apply a basic P/E ratio analysis to Apollo Sindoori Hotels Limited's (NSE:APOLSINHOT), to help you decide if the stock is worth further research. Apollo Sindoori Hotels has a price to earnings ratio of 11.21, based on the last twelve months. That means that at current prices, buyers pay ₹11.21 for every ₹1 in trailing yearly profits.
Check out our latest analysis for Apollo Sindoori Hotels
How Do I Calculate A Price To Earnings Ratio?
The formula for price to earnings is:
Price to Earnings Ratio = Price per Share ÷ Earnings per Share (EPS)
Or for Apollo Sindoori Hotels:
P/E of 11.21 = ₹886.2 ÷ ₹79.07 (Based on the trailing twelve months to March 2019.)
Is A High Price-to-Earnings Ratio Good?
The higher the P/E ratio, the higher the price tag of a business, relative to its trailing earnings. That isn't necessarily good or bad, but a high P/E implies relatively high expectations of what a company can achieve in the future.
How Does Apollo Sindoori Hotels's P/E Ratio Compare To Its Peers?
The P/E ratio essentially measures market expectations of a company. If you look at the image below, you can see Apollo Sindoori Hotels has a lower P/E than the average (16.7) in the commercial services industry classification.
Apollo Sindoori Hotels's P/E tells us that market participants think it will not fare as well as its peers in the same industry. Since the market seems unimpressed with Apollo Sindoori Hotels, it's quite possible it could surprise on the upside. It is arguably worth checking if insiders are buying shares, because that might imply they believe the stock is undervalued.
How Growth Rates Impact P/E Ratios
Probably the most important factor in determining what P/E a company trades on is the earnings growth. When earnings grow, the 'E' increases, over time. That means unless the share price increases, the P/E will reduce in a few years. So while a stock may look expensive based on past earnings, it could be cheap based on future earnings.
Apollo Sindoori Hotels increased earnings per share by a whopping 35% last year. And its annual EPS growth rate over 5 years is 59%. So we'd generally expect it to have a relatively high P/E ratio.
A Limitation: P/E Ratios Ignore Debt and Cash In The Bank
The 'Price' in P/E reflects the market capitalization of the company. In other words, it does not consider any debt or cash that the company may have on the balance sheet. Theoretically, a business can improve its earnings (and produce a lower P/E in the future) by investing in growth. That means taking on debt (or spending its cash).
Spending on growth might be good or bad a few years later, but the point is that the P/E ratio does not account for the option (or lack thereof).
So What Does Apollo Sindoori Hotels's Balance Sheet Tell Us?
The extra options and safety that comes with Apollo Sindoori Hotels's ₹151m net cash position means that it deserves a higher P/E than it would if it had a lot of net debt.
The Verdict On Apollo Sindoori Hotels's P/E Ratio
Apollo Sindoori Hotels's P/E is 11.2 which is below average (13.6) in the IN market. The net cash position gives plenty of options to the business, and the recent improvement in EPS is good to see. The below average P/E ratio suggests that market participants don't believe the strong growth will continue.
Investors have an opportunity when market expectations about a stock are wrong. If the reality for a company is not as bad as the P/E ratio indicates, then the share price should increase as the market realizes this. We don't have analyst forecasts, but you could get a better understanding of its growth by checking out this more detailed historical graph of earnings, revenue and cash flow.
Of course, you might find a fantastic investment by looking at a few good candidates. So take a peek at this free list of companies with modest (or no) debt, trading on a P/E below 20.
We aim to bring you long-term focused research analysis driven by fundamental data. Note that our analysis may not factor in the latest price-sensitive company announcements or qualitative material.
If you spot an error that warrants correction, please contact the editor at editorial-team@simplywallst.com. This article by Simply Wall St is general in nature. It does not constitute a recommendation to buy or sell any stock, and does not take account of your objectives, or your financial situation. Simply Wall St has no position in the stocks mentioned. Thank you for reading.

