What Does Arcos Dorados Holdings Inc.'s (NYSE:ARCO) P/E Ratio Tell You?

Want to participate in a short research study? Help shape the future of investing tools and you could win a $250 gift card!
The goal of this article is to teach you how to use price to earnings ratios (P/E ratios). We'll show how you can use Arcos Dorados Holdings Inc.'s (NYSE:ARCO) P/E ratio to inform your assessment of the investment opportunity. Looking at earnings over the last twelve months, Arcos Dorados Holdings has a P/E ratio of 28.44. That corresponds to an earnings yield of approximately 3.5%.
Check out our latest analysis for Arcos Dorados Holdings
How Do You Calculate A P/E Ratio?
The formula for price to earnings is:
Price to Earnings Ratio = Price per Share ÷ Earnings per Share (EPS)
Or for Arcos Dorados Holdings:
P/E of 28.44 = $6.65 ÷ $0.23 (Based on the year to March 2019.)
Is A High Price-to-Earnings Ratio Good?
A higher P/E ratio means that investors are paying a higher price for each $1 of company earnings. That is not a good or a bad thing per se, but a high P/E does imply buyers are optimistic about the future.
How Growth Rates Impact P/E Ratios
Probably the most important factor in determining what P/E a company trades on is the earnings growth. Earnings growth means that in the future the 'E' will be higher. That means even if the current P/E is high, it will reduce over time if the share price stays flat. And as that P/E ratio drops, the company will look cheap, unless its share price increases.
Arcos Dorados Holdings saw earnings per share decrease by 45% last year. But it has grown its earnings per share by 4.3% per year over the last five years.
Does Arcos Dorados Holdings Have A Relatively High Or Low P/E For Its Industry?
The P/E ratio indicates whether the market has higher or lower expectations of a company. You can see in the image below that the average P/E (22.7) for companies in the hospitality industry is lower than Arcos Dorados Holdings's P/E.
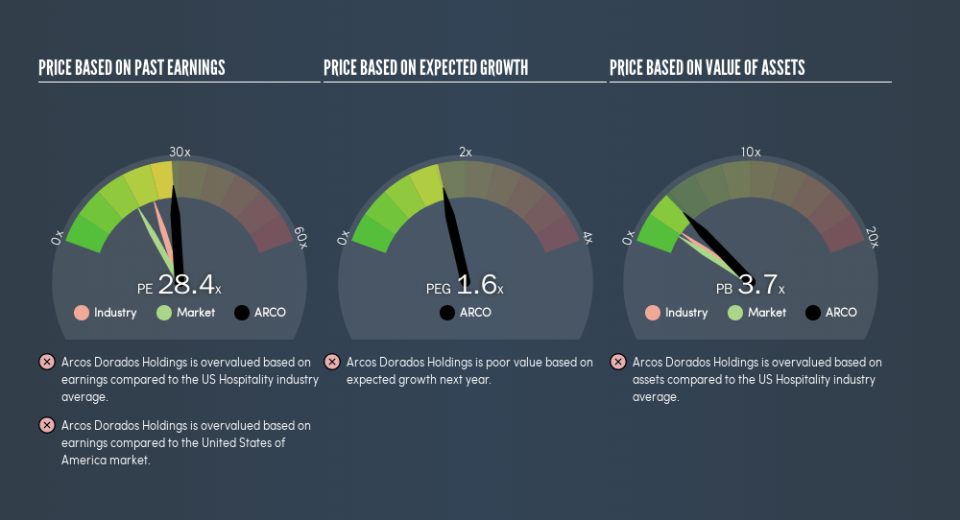
Its relatively high P/E ratio indicates that Arcos Dorados Holdings shareholders think it will perform better than other companies in its industry classification. Shareholders are clearly optimistic, but the future is always uncertain. So further research is always essential. I often monitor director buying and selling.
A Limitation: P/E Ratios Ignore Debt and Cash In The Bank
One drawback of using a P/E ratio is that it considers market capitalization, but not the balance sheet. That means it doesn't take debt or cash into account. Theoretically, a business can improve its earnings (and produce a lower P/E in the future) by investing in growth. That means taking on debt (or spending its cash).
Such spending might be good or bad, overall, but the key point here is that you need to look at debt to understand the P/E ratio in context.
Arcos Dorados Holdings's Balance Sheet
Arcos Dorados Holdings's net debt equates to 35% of its market capitalization. While that's enough to warrant consideration, it doesn't really concern us.
The Verdict On Arcos Dorados Holdings's P/E Ratio
Arcos Dorados Holdings's P/E is 28.4 which is above average (17.6) in the US market. With a bit of debt, but a lack of recent growth, it's safe to say the market is expecting improved profit performance from the company, in the next few years.
Investors should be looking to buy stocks that the market is wrong about. As value investor Benjamin Graham famously said, 'In the short run, the market is a voting machine but in the long run, it is a weighing machine.' So this free visual report on analyst forecasts could hold the key to an excellent investment decision.
But note: Arcos Dorados Holdings may not be the best stock to buy. So take a peek at this free list of interesting companies with strong recent earnings growth (and a P/E ratio below 20).
We aim to bring you long-term focused research analysis driven by fundamental data. Note that our analysis may not factor in the latest price-sensitive company announcements or qualitative material.
If you spot an error that warrants correction, please contact the editor at editorial-team@simplywallst.com. This article by Simply Wall St is general in nature. It does not constitute a recommendation to buy or sell any stock, and does not take account of your objectives, or your financial situation. Simply Wall St has no position in the stocks mentioned. Thank you for reading.
