What Does AstraZeneca Pharma India Limited's (NSE:ASTRAZEN) P/E Ratio Tell You?

Today, we'll introduce the concept of the P/E ratio for those who are learning about investing. We'll apply a basic P/E ratio analysis to AstraZeneca Pharma India Limited's (NSE:ASTRAZEN), to help you decide if the stock is worth further research. Looking at earnings over the last twelve months, AstraZeneca Pharma India has a P/E ratio of 75.01. That is equivalent to an earnings yield of about 1.3%.
Check out our latest analysis for AstraZeneca Pharma India
How Do You Calculate AstraZeneca Pharma India's P/E Ratio?
The formula for price to earnings is:
Price to Earnings Ratio = Price per Share ÷ Earnings per Share (EPS)
Or for AstraZeneca Pharma India:
P/E of 75.01 = ₹2087.20 ÷ ₹27.82 (Based on the trailing twelve months to June 2019.)
Is A High Price-to-Earnings Ratio Good?
The higher the P/E ratio, the higher the price tag of a business, relative to its trailing earnings. That isn't a good or a bad thing on its own, but a high P/E means that buyers have a higher opinion of the business's prospects, relative to stocks with a lower P/E.
How Does AstraZeneca Pharma India's P/E Ratio Compare To Its Peers?
The P/E ratio essentially measures market expectations of a company. The image below shows that AstraZeneca Pharma India has a significantly higher P/E than the average (15.9) P/E for companies in the pharmaceuticals industry.
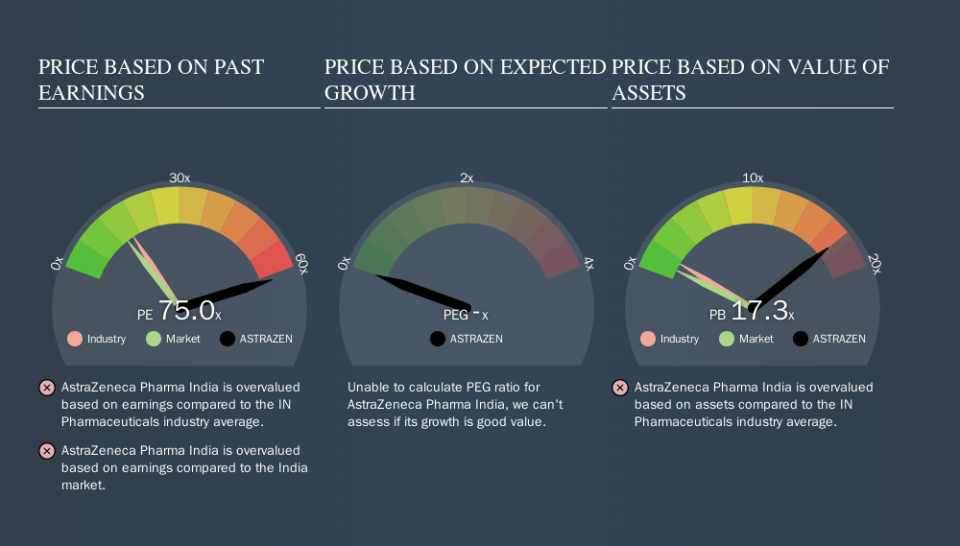
AstraZeneca Pharma India's P/E tells us that market participants think the company will perform better than its industry peers, going forward. Shareholders are clearly optimistic, but the future is always uncertain. So investors should always consider the P/E ratio alongside other factors, such as whether company directors have been buying shares.
How Growth Rates Impact P/E Ratios
P/E ratios primarily reflect market expectations around earnings growth rates. If earnings are growing quickly, then the 'E' in the equation will increase faster than it would otherwise. Therefore, even if you pay a high multiple of earnings now, that multiple will become lower in the future. And as that P/E ratio drops, the company will look cheap, unless its share price increases.
AstraZeneca Pharma India's 162% EPS improvement over the last year was like bamboo growth after rain; rapid and impressive. And earnings per share have improved by 74% annually, over the last three years. So we'd absolutely expect it to have a relatively high P/E ratio.
A Limitation: P/E Ratios Ignore Debt and Cash In The Bank
Don't forget that the P/E ratio considers market capitalization. So it won't reflect the advantage of cash, or disadvantage of debt. In theory, a company can lower its future P/E ratio by using cash or debt to invest in growth.
Such expenditure might be good or bad, in the long term, but the point here is that the balance sheet is not reflected by this ratio.
AstraZeneca Pharma India's Balance Sheet
The extra options and safety that comes with AstraZeneca Pharma India's ₹1.7b net cash position means that it deserves a higher P/E than it would if it had a lot of net debt.
The Verdict On AstraZeneca Pharma India's P/E Ratio
With a P/E ratio of 75.0, AstraZeneca Pharma India is expected to grow earnings very strongly in the years to come. The excess cash it carries is the gravy on top its fast EPS growth. So based on this analysis we'd expect AstraZeneca Pharma India to have a high P/E ratio.
Investors should be looking to buy stocks that the market is wrong about. If the reality for a company is better than it expects, you can make money by buying and holding for the long term. So this free report on the analyst consensus forecasts could help you make a master move on this stock.
But note: AstraZeneca Pharma India may not be the best stock to buy. So take a peek at this free list of interesting companies with strong recent earnings growth (and a P/E ratio below 20).
We aim to bring you long-term focused research analysis driven by fundamental data. Note that our analysis may not factor in the latest price-sensitive company announcements or qualitative material.
If you spot an error that warrants correction, please contact the editor at editorial-team@simplywallst.com. This article by Simply Wall St is general in nature. It does not constitute a recommendation to buy or sell any stock, and does not take account of your objectives, or your financial situation. Simply Wall St has no position in the stocks mentioned. Thank you for reading.
