Does Baxter International Inc. (NYSE:BAX) Have A Good P/E Ratio?

Want to participate in a short research study? Help shape the future of investing tools and you could win a $250 gift card!
This article is for investors who would like to improve their understanding of price to earnings ratios (P/E ratios). We’ll look at Baxter International Inc.’s (NYSE:BAX) P/E ratio and reflect on what it tells us about the company’s share price. Based on the last twelve months, Baxter International’s P/E ratio is 23.81. That corresponds to an earnings yield of approximately 4.2%.
Check out our latest analysis for Baxter International
How Do I Calculate Baxter International’s Price To Earnings Ratio?
The formula for price to earnings is:
Price to Earnings Ratio = Price per Share ÷ Earnings per Share (EPS)
Or for Baxter International:
P/E of 23.81 = $72.67 ÷ $3.05 (Based on the trailing twelve months to December 2018.)
Is A High Price-to-Earnings Ratio Good?
A higher P/E ratio means that investors are paying a higher price for each $1 of company earnings. That isn’t a good or a bad thing on its own, but a high P/E means that buyers have a higher opinion of the business’s prospects, relative to stocks with a lower P/E.
How Growth Rates Impact P/E Ratios
If earnings fall then in the future the ‘E’ will be lower. That means even if the current P/E is low, it will increase over time if the share price stays flat. A higher P/E should indicate the stock is expensive relative to others — and that may encourage shareholders to sell.
Baxter International increased earnings per share by a whopping 129% last year. And its annual EPS growth rate over 5 years is 9.5%. I’d therefore be a little surprised if its P/E ratio was not relatively high. But earnings per share are down 42% per year over the last three years.
How Does Baxter International’s P/E Ratio Compare To Its Peers?
We can get an indication of market expectations by looking at the P/E ratio. We can see in the image below that the average P/E (48.6) for companies in the medical equipment industry is higher than Baxter International’s P/E.
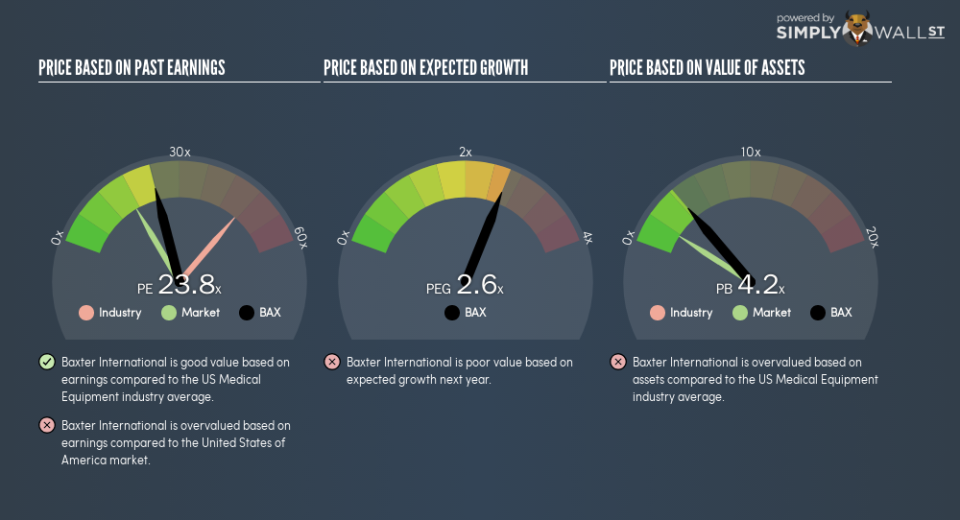
This suggests that market participants think Baxter International will underperform other companies in its industry. While current expectations are low, the stock could be undervalued if the situation is better than the market assumes. It is arguably worth checking if insiders are buying shares, because that might imply they believe the stock is undervalued.
A Limitation: P/E Ratios Ignore Debt and Cash In The Bank
It’s important to note that the P/E ratio considers the market capitalization, not the enterprise value. That means it doesn’t take debt or cash into account. Hypothetically, a company could reduce its future P/E ratio by spending its cash (or taking on debt) to achieve higher earnings.
Such spending might be good or bad, overall, but the key point here is that you need to look at debt to understand the P/E ratio in context.
Baxter International’s Balance Sheet
Net debt totals just 1.6% of Baxter International’s market cap. So it doesn’t have as many options as it would with net cash, but its debt would not have much of an impact on its P/E ratio.
The Bottom Line On Baxter International’s P/E Ratio
Baxter International trades on a P/E ratio of 23.8, which is above the US market average of 17. Its debt levels do not imperil its balance sheet and it has already proven it can grow. So it does not seem strange that the P/E is above average.
Investors have an opportunity when market expectations about a stock are wrong. As value investor Benjamin Graham famously said, ‘In the short run, the market is a voting machine but in the long run, it is a weighing machine.’ So this free visualization of the analyst consensus on future earnings could help you make the right decision about whether to buy, sell, or hold.
You might be able to find a better buy than Baxter International. If you want a selection of possible winners, check out this free list of interesting companies that trade on a P/E below 20 (but have proven they can grow earnings).
To help readers see past the short term volatility of the financial market, we aim to bring you a long-term focused research analysis purely driven by fundamental data. Note that our analysis does not factor in the latest price-sensitive company announcements.
The author is an independent contributor and at the time of publication had no position in the stocks mentioned. For errors that warrant correction please contact the editor at editorial-team@simplywallst.com.

