How Does Beluga Group's (MCX:BELU) P/E Compare To Its Industry, After Its Big Share Price Gain?

The Beluga Group (MCX:BELU) share price has done well in the last month, posting a gain of 31%. Zooming out, the annual gain of 114% knocks our socks off.
All else being equal, a sharp share price increase should make a stock less attractive to potential investors. While the market sentiment towards a stock is very changeable, in the long run, the share price will tend to move in the same direction as earnings per share. So some would prefer to hold off buying when there is a lot of optimism towards a stock. Perhaps the simplest way to get a read on investors' expectations of a business is to look at its Price to Earnings Ratio (PE Ratio). Investors have optimistic expectations of companies with higher P/E ratios, compared to companies with lower P/E ratios.
Check out our latest analysis for Beluga Group
Does Beluga Group Have A Relatively High Or Low P/E For Its Industry?
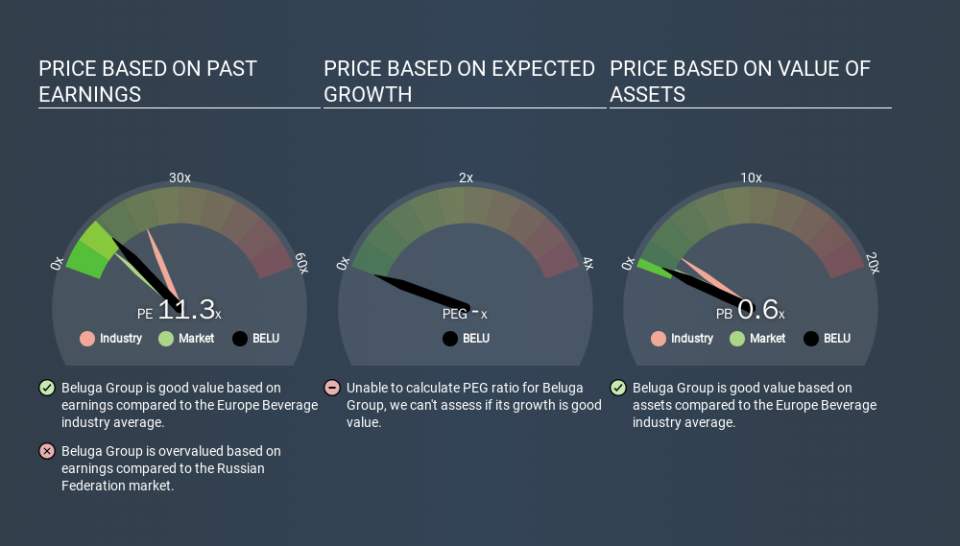
Beluga Group's P/E of 11.27 indicates relatively low sentiment towards the stock. If you look at the image below, you can see Beluga Group has a lower P/E than the average (20.4) in the beverage industry classification.
Its relatively low P/E ratio indicates that Beluga Group shareholders think it will struggle to do as well as other companies in its industry classification. Since the market seems unimpressed with Beluga Group, it's quite possible it could surprise on the upside. It is arguably worth checking if insiders are buying shares, because that might imply they believe the stock is undervalued.
How Growth Rates Impact P/E Ratios
P/E ratios primarily reflect market expectations around earnings growth rates. When earnings grow, the 'E' increases, over time. That means even if the current P/E is high, it will reduce over time if the share price stays flat. Then, a lower P/E should attract more buyers, pushing the share price up.
In the last year, Beluga Group grew EPS like Taylor Swift grew her fan base back in 2010; the 59% gain was both fast and well deserved. Even better, EPS is up 76% per year over three years. So you might say it really deserves to have an above-average P/E ratio.
Don't Forget: The P/E Does Not Account For Debt or Bank Deposits
It's important to note that the P/E ratio considers the market capitalization, not the enterprise value. Thus, the metric does not reflect cash or debt held by the company. In theory, a company can lower its future P/E ratio by using cash or debt to invest in growth.
Such spending might be good or bad, overall, but the key point here is that you need to look at debt to understand the P/E ratio in context.
How Does Beluga Group's Debt Impact Its P/E Ratio?
Beluga Group's net debt is considerable, at 136% of its market cap. If you want to compare its P/E ratio to other companies, you must keep in mind that these debt levels would usually warrant a relatively low P/E.
The Verdict On Beluga Group's P/E Ratio
Beluga Group's P/E is 11.3 which is above average (8.7) in its market. Its meaningful level of debt should warrant a lower P/E ratio, but the fast EPS growth is a positive. So it seems likely the market is overlooking the debt because of the fast earnings growth. What we know for sure is that investors have become more excited about Beluga Group recently, since they have pushed its P/E ratio from 8.6 to 11.3 over the last month. For those who prefer to invest with the flow of momentum, that might mean it's time to put the stock on a watchlist, or research it. But the contrarian may see it as a missed opportunity.
Investors have an opportunity when market expectations about a stock are wrong. If the reality for a company is better than it expects, you can make money by buying and holding for the long term. Although we don't have analyst forecasts you could get a better understanding of its growth by checking out this more detailed historical graph of earnings, revenue and cash flow.
You might be able to find a better buy than Beluga Group. If you want a selection of possible winners, check out this free list of interesting companies that trade on a P/E below 20 (but have proven they can grow earnings).
If you spot an error that warrants correction, please contact the editor at editorial-team@simplywallst.com. This article by Simply Wall St is general in nature. It does not constitute a recommendation to buy or sell any stock, and does not take account of your objectives, or your financial situation. Simply Wall St has no position in the stocks mentioned.
We aim to bring you long-term focused research analysis driven by fundamental data. Note that our analysis may not factor in the latest price-sensitive company announcements or qualitative material. Thank you for reading.
