What Does Bridge Bancorp, Inc.'s (NASDAQ:BDGE) P/E Ratio Tell You?

This article is written for those who want to get better at using price to earnings ratios (P/E ratios). To keep it practical, we'll show how Bridge Bancorp, Inc.'s (NASDAQ:BDGE) P/E ratio could help you assess the value on offer. Looking at earnings over the last twelve months, Bridge Bancorp has a P/E ratio of 12.82. That is equivalent to an earnings yield of about 7.8%.
See our latest analysis for Bridge Bancorp
How Do You Calculate A P/E Ratio?
The formula for P/E is:
Price to Earnings Ratio = Price per Share ÷ Earnings per Share (EPS)
Or for Bridge Bancorp:
P/E of 12.82 = $33.03 ÷ $2.58 (Based on the trailing twelve months to September 2019.)
Is A High Price-to-Earnings Ratio Good?
A higher P/E ratio implies that investors pay a higher price for the earning power of the business. That isn't a good or a bad thing on its own, but a high P/E means that buyers have a higher opinion of the business's prospects, relative to stocks with a lower P/E.
How Does Bridge Bancorp's P/E Ratio Compare To Its Peers?
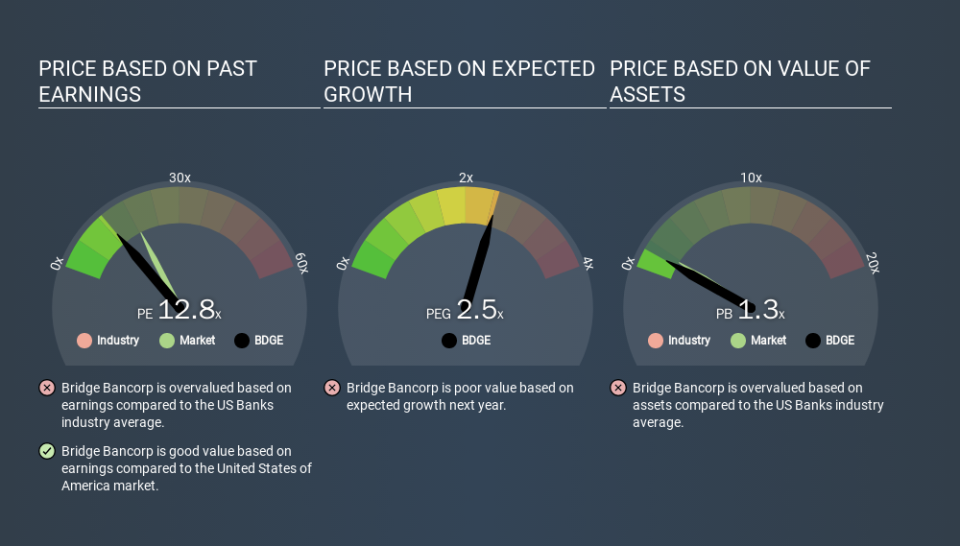
The P/E ratio essentially measures market expectations of a company. The image below shows that Bridge Bancorp has a P/E ratio that is roughly in line with the banks industry average (12.7).
Its P/E ratio suggests that Bridge Bancorp shareholders think that in the future it will perform about the same as other companies in its industry classification. The company could surprise by performing better than average, in the future. Checking factors such as director buying and selling. could help you form your own view on if that will happen.
How Growth Rates Impact P/E Ratios
Probably the most important factor in determining what P/E a company trades on is the earnings growth. If earnings are growing quickly, then the 'E' in the equation will increase faster than it would otherwise. That means unless the share price increases, the P/E will reduce in a few years. So while a stock may look expensive based on past earnings, it could be cheap based on future earnings.
Bridge Bancorp's 177% EPS improvement over the last year was like bamboo growth after rain; rapid and impressive. The sweetener is that the annual five year growth rate of 18% is also impressive. With that kind of growth rate we would generally expect a high P/E ratio.
Remember: P/E Ratios Don't Consider The Balance Sheet
The 'Price' in P/E reflects the market capitalization of the company. Thus, the metric does not reflect cash or debt held by the company. Theoretically, a business can improve its earnings (and produce a lower P/E in the future) by investing in growth. That means taking on debt (or spending its cash).
While growth expenditure doesn't always pay off, the point is that it is a good option to have; but one that the P/E ratio ignores.
Is Debt Impacting Bridge Bancorp's P/E?
Bridge Bancorp's net debt equates to 45% of its market capitalization. You'd want to be aware of this fact, but it doesn't bother us.
The Verdict On Bridge Bancorp's P/E Ratio
Bridge Bancorp's P/E is 12.8 which is below average (18.4) in the US market. The company hasn't stretched its balance sheet, and earnings growth was good last year. The low P/E ratio suggests current market expectations are muted, implying these levels of growth will not continue.
Investors have an opportunity when market expectations about a stock are wrong. If it is underestimating a company, investors can make money by buying and holding the shares until the market corrects itself. So this free visual report on analyst forecasts could hold the key to an excellent investment decision.
You might be able to find a better buy than Bridge Bancorp. If you want a selection of possible winners, check out this free list of interesting companies that trade on a P/E below 20 (but have proven they can grow earnings).
If you spot an error that warrants correction, please contact the editor at editorial-team@simplywallst.com. This article by Simply Wall St is general in nature. It does not constitute a recommendation to buy or sell any stock, and does not take account of your objectives, or your financial situation. Simply Wall St has no position in the stocks mentioned.
We aim to bring you long-term focused research analysis driven by fundamental data. Note that our analysis may not factor in the latest price-sensitive company announcements or qualitative material. Thank you for reading.
