Does Bright Horizons Family Solutions Inc.'s (NYSE:BFAM) Debt Level Pose A Problem?

Want to participate in a short research study? Help shape the future of investing tools and you could win a $250 gift card!
Small and large cap stocks are widely popular for a variety of reasons, however, mid-cap companies such as Bright Horizons Family Solutions Inc. (NYSE:BFAM), with a market cap of US$8.1b, often get neglected by retail investors. However, history shows that overlooked mid-cap companies have performed better on a risk-adjusted manner than the smaller and larger segment of the market. This article will examine BFAM’s financial liquidity and debt levels to get an idea of whether the company can deal with cyclical downturns and maintain funds to accommodate strategic spending for future growth. Don’t forget that this is a general and concentrated examination of Bright Horizons Family Solutions’s financial health, so you should conduct further analysis into BFAM here.
View our latest analysis for Bright Horizons Family Solutions
Does BFAM Produce Much Cash Relative To Its Debt?
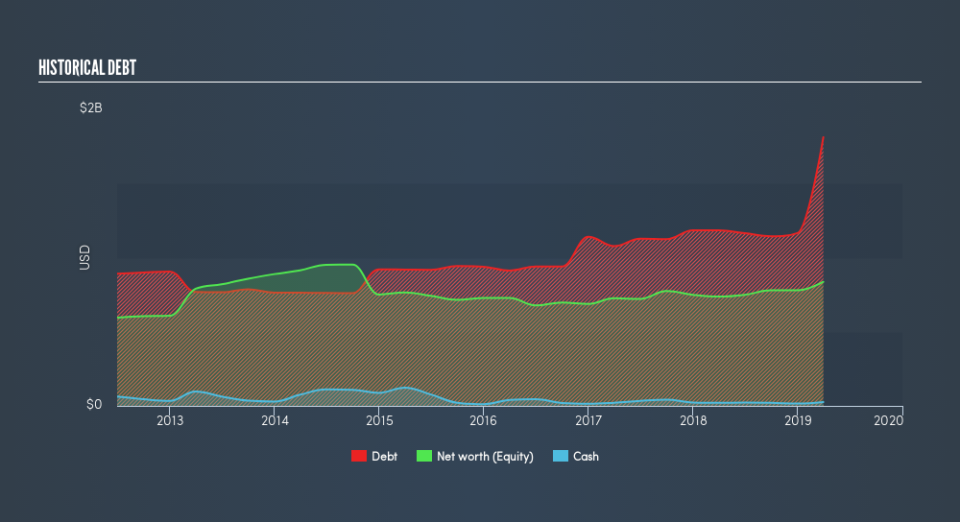
BFAM has built up its total debt levels in the last twelve months, from US$1.2b to US$1.8b – this includes long-term debt. With this growth in debt, the current cash and short-term investment levels stands at US$26m , ready to be used for running the business. On top of this, BFAM has produced US$296m in operating cash flow over the same time period, resulting in an operating cash to total debt ratio of 16%, indicating that BFAM’s operating cash is less than its debt.
Can BFAM meet its short-term obligations with the cash in hand?
Looking at BFAM’s US$514m in current liabilities, it appears that the company arguably has a rather low level of current assets relative its obligations, with the current ratio last standing at 0.36x. The current ratio is the number you get when you divide current assets by current liabilities.
Does BFAM face the risk of succumbing to its debt-load?
Since total debt growth have outpaced equity growth, BFAM is a highly leveraged company. This is not unusual for mid-caps as debt tends to be a cheaper and faster source of funding for some businesses. No matter how high the company’s debt, if it can easily cover the interest payments, it’s considered to be efficient with its use of excess leverage. A company generating earnings after interest and tax at least three times its net interest payments is considered financially sound. In BFAM's case, the ratio of 5.15x suggests that interest is appropriately covered, which means that debtors may be willing to loan the company more money, giving BFAM ample headroom to grow its debt facilities.
Next Steps:
BFAM’s high cash coverage means that, although its debt levels are high, the company is able to utilise its borrowings efficiently in order to generate cash flow. Though its lack of liquidity raises questions over current asset management practices for the mid-cap. I admit this is a fairly basic analysis for BFAM's financial health. Other important fundamentals need to be considered alongside. I suggest you continue to research Bright Horizons Family Solutions to get a better picture of the stock by looking at:
Future Outlook: What are well-informed industry analysts predicting for BFAM’s future growth? Take a look at our free research report of analyst consensus for BFAM’s outlook.
Valuation: What is BFAM worth today? Is the stock undervalued, even when its growth outlook is factored into its intrinsic value? The intrinsic value infographic in our free research report helps visualize whether BFAM is currently mispriced by the market.
Other High-Performing Stocks: Are there other stocks that provide better prospects with proven track records? Explore our free list of these great stocks here.
We aim to bring you long-term focused research analysis driven by fundamental data. Note that our analysis may not factor in the latest price-sensitive company announcements or qualitative material.
If you spot an error that warrants correction, please contact the editor at editorial-team@simplywallst.com. This article by Simply Wall St is general in nature. It does not constitute a recommendation to buy or sell any stock, and does not take account of your objectives, or your financial situation. Simply Wall St has no position in the stocks mentioned. Thank you for reading.
