How Does Cavco Industries's (NASDAQ:CVCO) P/E Compare To Its Industry, After The Share Price Drop?

To the annoyance of some shareholders, Cavco Industries (NASDAQ:CVCO) shares are down a considerable 43% in the last month. The recent drop has obliterated the annual return, with the share price now down 5.9% over that longer period.
Assuming nothing else has changed, a lower share price makes a stock more attractive to potential buyers. While the market sentiment towards a stock is very changeable, in the long run, the share price will tend to move in the same direction as earnings per share. The implication here is that long term investors have an opportunity when expectations of a company are too low. One way to gauge market expectations of a stock is to look at its Price to Earnings Ratio (PE Ratio). A high P/E implies that investors have high expectations of what a company can achieve compared to a company with a low P/E ratio.
Check out our latest analysis for Cavco Industries
Does Cavco Industries Have A Relatively High Or Low P/E For Its Industry?
Cavco Industries's P/E of 12.95 indicates some degree of optimism towards the stock. You can see in the image below that the average P/E (7.2) for companies in the consumer durables industry is lower than Cavco Industries's P/E.
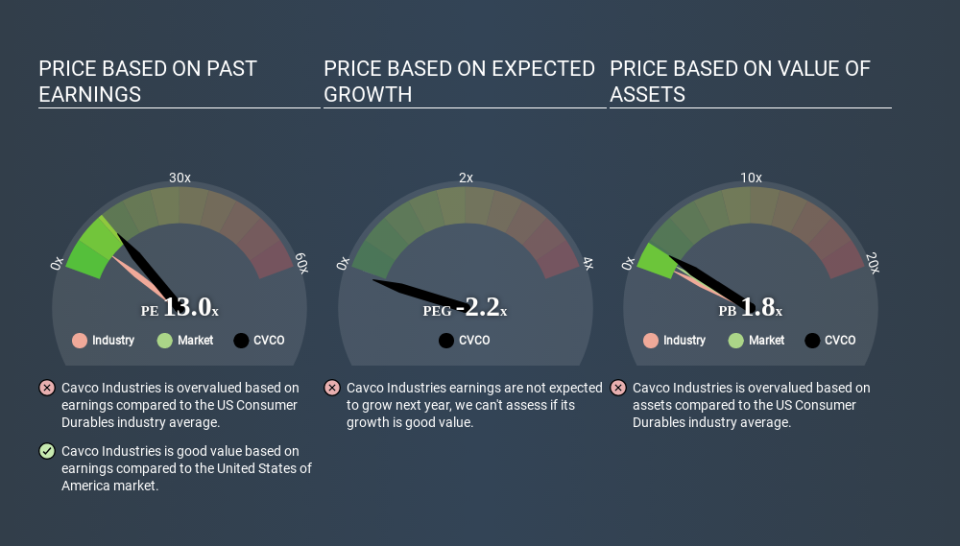
That means that the market expects Cavco Industries will outperform other companies in its industry. Clearly the market expects growth, but it isn't guaranteed. So further research is always essential. I often monitor director buying and selling.
How Growth Rates Impact P/E Ratios
Probably the most important factor in determining what P/E a company trades on is the earnings growth. Earnings growth means that in the future the 'E' will be higher. That means even if the current P/E is high, it will reduce over time if the share price stays flat. Then, a lower P/E should attract more buyers, pushing the share price up.
Cavco Industries increased earnings per share by an impressive 17% over the last twelve months. And its annual EPS growth rate over 5 years is 30%. This could arguably justify a relatively high P/E ratio.
A Limitation: P/E Ratios Ignore Debt and Cash In The Bank
One drawback of using a P/E ratio is that it considers market capitalization, but not the balance sheet. Thus, the metric does not reflect cash or debt held by the company. In theory, a company can lower its future P/E ratio by using cash or debt to invest in growth.
Such expenditure might be good or bad, in the long term, but the point here is that the balance sheet is not reflected by this ratio.
So What Does Cavco Industries's Balance Sheet Tell Us?
Cavco Industries has net cash of US$216m. This is fairly high at 16% of its market capitalization. That might mean balance sheet strength is important to the business, but should also help push the P/E a bit higher than it would otherwise be.
The Bottom Line On Cavco Industries's P/E Ratio
Cavco Industries's P/E is 13.0 which is about average (12.9) in the US market. Considering its recent growth, alongside its lack of debt, it would appear that the market isn't very excited about the future. Given Cavco Industries's P/E ratio has declined from 22.6 to 13.0 in the last month, we know for sure that the market is significantly less confident about the business today, than it was back then. For those who don't like to trade against momentum, that could be a warning sign, but a contrarian investor might want to take a closer look.
When the market is wrong about a stock, it gives savvy investors an opportunity. As value investor Benjamin Graham famously said, 'In the short run, the market is a voting machine but in the long run, it is a weighing machine. So this free report on the analyst consensus forecasts could help you make a master move on this stock.
But note: Cavco Industries may not be the best stock to buy. So take a peek at this free list of interesting companies with strong recent earnings growth (and a P/E ratio below 20).
If you spot an error that warrants correction, please contact the editor at editorial-team@simplywallst.com. This article by Simply Wall St is general in nature. It does not constitute a recommendation to buy or sell any stock, and does not take account of your objectives, or your financial situation. Simply Wall St has no position in the stocks mentioned.
We aim to bring you long-term focused research analysis driven by fundamental data. Note that our analysis may not factor in the latest price-sensitive company announcements or qualitative material. Thank you for reading.

