Does CENIT Aktiengesellschaft's (FRA:CSH) P/E Ratio Signal A Buying Opportunity?

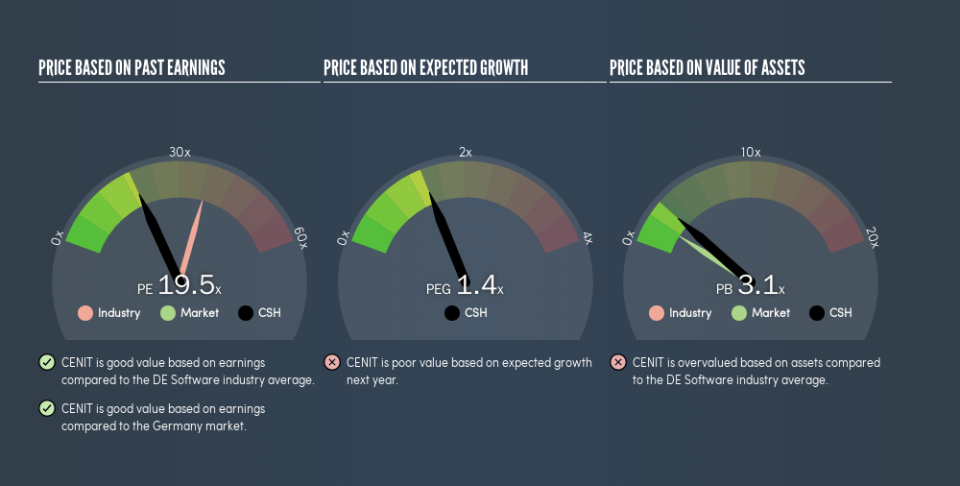
This article is for investors who would like to improve their understanding of price to earnings ratios (P/E ratios). We'll show how you can use CENIT Aktiengesellschaft's (FRA:CSH) P/E ratio to inform your assessment of the investment opportunity. Based on the last twelve months, CENIT's P/E ratio is 19.48. That corresponds to an earnings yield of approximately 5.1%.
Check out our latest analysis for CENIT
How Do You Calculate A P/E Ratio?
The formula for price to earnings is:
Price to Earnings Ratio = Price per Share ÷ Earnings per Share (EPS)
Or for CENIT:
P/E of 19.48 = €13.85 ÷ €0.71 (Based on the trailing twelve months to December 2018.)
Is A High Price-to-Earnings Ratio Good?
A higher P/E ratio implies that investors pay a higher price for the earning power of the business. All else being equal, it's better to pay a low price -- but as Warren Buffett said, 'It's far better to buy a wonderful company at a fair price than a fair company at a wonderful price.'
How Growth Rates Impact P/E Ratios
Companies that shrink earnings per share quickly will rapidly decrease the 'E' in the equation. That means unless the share price falls, the P/E will increase in a few years. Then, a higher P/E might scare off shareholders, pushing the share price down.
CENIT shrunk earnings per share by 32% over the last year. And it has shrunk its earnings per share by 6.7% per year over the last three years. This might lead to low expectations.
How Does CENIT's P/E Ratio Compare To Its Peers?
One good way to get a quick read on what market participants expect of a company is to look at its P/E ratio. The image below shows that CENIT has a lower P/E than the average (36.7) P/E for companies in the software industry.
This suggests that market participants think CENIT will underperform other companies in its industry. Since the market seems unimpressed with CENIT, it's quite possible it could surprise on the upside. If you consider the stock interesting, further research is recommended. For example, I often monitor director buying and selling.
A Limitation: P/E Ratios Ignore Debt and Cash In The Bank
It's important to note that the P/E ratio considers the market capitalization, not the enterprise value. So it won't reflect the advantage of cash, or disadvantage of debt. In theory, a company can lower its future P/E ratio by using cash or debt to invest in growth.
Such spending might be good or bad, overall, but the key point here is that you need to look at debt to understand the P/E ratio in context.
How Does CENIT's Debt Impact Its P/E Ratio?
CENIT has net cash of €18m. This is fairly high at 16% of its market capitalization. That might mean balance sheet strength is important to the business, but should also help push the P/E a bit higher than it would otherwise be.
The Verdict On CENIT's P/E Ratio
CENIT's P/E is 19.5 which is about average (19.6) in the DE market. Although the recent drop in earnings per share would keep the market cautious, the net cash position means it's not surprising that expectations put the company roughly in line with the market average P/E.
Investors should be looking to buy stocks that the market is wrong about. If it is underestimating a company, investors can make money by buying and holding the shares until the market corrects itself. So this free report on the analyst consensus forecasts could help you make a master move on this stock.
Of course, you might find a fantastic investment by looking at a few good candidates. So take a peek at this free list of companies with modest (or no) debt, trading on a P/E below 20.
We aim to bring you long-term focused research analysis driven by fundamental data. Note that our analysis may not factor in the latest price-sensitive company announcements or qualitative material.
If you spot an error that warrants correction, please contact the editor at editorial-team@simplywallst.com. This article by Simply Wall St is general in nature. It does not constitute a recommendation to buy or sell any stock, and does not take account of your objectives, or your financial situation. Simply Wall St has no position in the stocks mentioned. Thank you for reading.
