Does China Boqi Environmental (Holding) Co., Ltd.’s (HKG:2377) P/E Ratio Signal A Buying Opportunity?

The goal of this article is to teach you how to use price to earnings ratios (P/E ratios). To keep it practical, we’ll show how China Boqi Environmental (Holding) Co., Ltd.’s (HKG:2377) P/E ratio could help you assess the value on offer. Based on the last twelve months, China Boqi Environmental (Holding)’s P/E ratio is 4.66. That is equivalent to an earnings yield of about 21%.
View our latest analysis for China Boqi Environmental (Holding)
How Do I Calculate A Price To Earnings Ratio?
The formula for P/E is:
Price to Earnings Ratio = Price per Share (in the reporting currency) ÷ Earnings per Share (EPS)
Or for China Boqi Environmental (Holding):
P/E of 4.66 = CN¥1.35 (Note: this is the share price in the reporting currency, namely, CNY ) ÷ CN¥0.29 (Based on the trailing twelve months to June 2018.)
Is A High Price-to-Earnings Ratio Good?
A higher P/E ratio implies that investors pay a higher price for the earning power of the business. That is not a good or a bad thing per se, but a high P/E does imply buyers are optimistic about the future.
How Growth Rates Impact P/E Ratios
Probably the most important factor in determining what P/E a company trades on is the earnings growth. When earnings grow, the ‘E’ increases, over time. That means unless the share price increases, the P/E will reduce in a few years. So while a stock may look expensive based on past earnings, it could be cheap based on future earnings.
China Boqi Environmental (Holding) saw earnings per share decrease by 2.0% last year.
How Does China Boqi Environmental (Holding)’s P/E Ratio Compare To Its Peers?
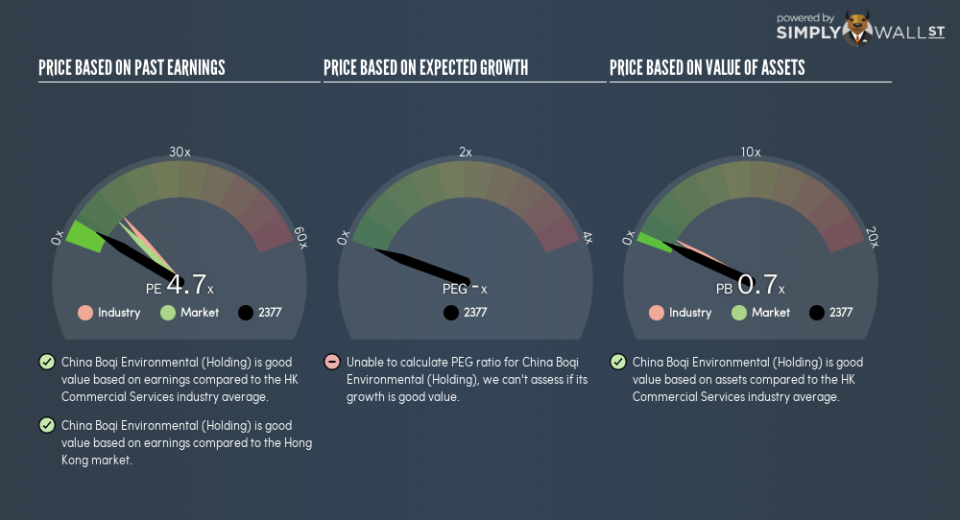
We can get an indication of market expectations by looking at the P/E ratio. If you look at the image below, you can see China Boqi Environmental (Holding) has a lower P/E than the average (12.6) in the commercial services industry classification.
Its relatively low P/E ratio indicates that China Boqi Environmental (Holding) shareholders think it will struggle to do as well as other companies in its industry classification. Many investors like to buy stocks when the market is pessimistic about their prospects. You should delve deeper. I like to check if company insiders have been buying or selling.
A Limitation: P/E Ratios Ignore Debt and Cash In The Bank
Don’t forget that the P/E ratio considers market capitalization. In other words, it does not consider any debt or cash that the company may have on the balance sheet. In theory, a company can lower its future P/E ratio by using cash or debt to invest in growth.
Such spending might be good or bad, overall, but the key point here is that you need to look at debt to understand the P/E ratio in context.
How Does China Boqi Environmental (Holding)’s Debt Impact Its P/E Ratio?
The extra options and safety that comes with China Boqi Environmental (Holding)’s CN¥664m net cash position means that it deserves a higher P/E than it would if it had a lot of net debt.
The Bottom Line On China Boqi Environmental (Holding)’s P/E Ratio
China Boqi Environmental (Holding) trades on a P/E ratio of 4.7, which is below the HK market average of 10.6. The recent drop in earnings per share would make investors cautious, but the net cash position means the company has time to improve: if so, the low P/E could be an opportunity.
Investors have an opportunity when market expectations about a stock are wrong. As value investor Benjamin Graham famously said, ‘In the short run, the market is a voting machine but in the long run, it is a weighing machine.’ We don’t have analyst forecasts, but shareholders might want to examine this detailed historical graph of earnings, revenue and cash flow.
Of course, you might find a fantastic investment by looking at a few good candidates. So take a peek at this free list of companies with modest (or no) debt, trading on a P/E below 20.
To help readers see past the short term volatility of the financial market, we aim to bring you a long-term focused research analysis purely driven by fundamental data. Note that our analysis does not factor in the latest price-sensitive company announcements.
The author is an independent contributor and at the time of publication had no position in the stocks mentioned. For errors that warrant correction please contact the editor at editorial-team@simplywallst.com.

