What Does China Evergrande Group's (HKG:3333) P/E Ratio Tell You?

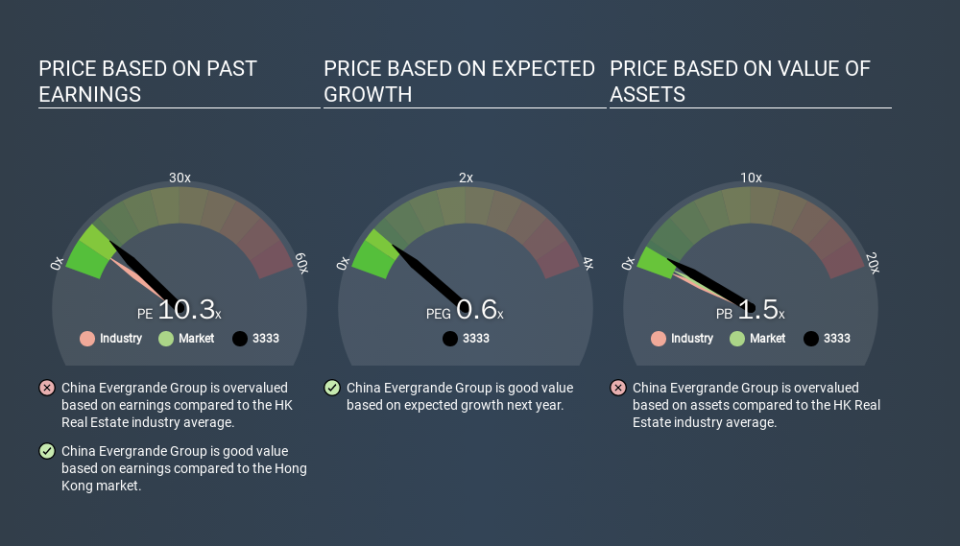
Today, we'll introduce the concept of the P/E ratio for those who are learning about investing. To keep it practical, we'll show how China Evergrande Group's (HKG:3333) P/E ratio could help you assess the value on offer. Based on the last twelve months, China Evergrande Group's P/E ratio is 10.27. That is equivalent to an earnings yield of about 9.7%.
Check out our latest analysis for China Evergrande Group
How Do You Calculate China Evergrande Group's P/E Ratio?
The formula for P/E is:
Price to Earnings Ratio = Price per Share (in the reporting currency) ÷ Earnings per Share (EPS)
Or for China Evergrande Group:
P/E of 10.27 = CNY16.86 (Note: this is the share price in the reporting currency, namely, CNY ) ÷ CNY1.64 (Based on the year to June 2019.)
Is A High P/E Ratio Good?
A higher P/E ratio means that investors are paying a higher price for each CNY1 of company earnings. That is not a good or a bad thing per se, but a high P/E does imply buyers are optimistic about the future.
Does China Evergrande Group Have A Relatively High Or Low P/E For Its Industry?
The P/E ratio indicates whether the market has higher or lower expectations of a company. The image below shows that China Evergrande Group has a higher P/E than the average (6.7) P/E for companies in the real estate industry.
That means that the market expects China Evergrande Group will outperform other companies in its industry. Shareholders are clearly optimistic, but the future is always uncertain. So investors should always consider the P/E ratio alongside other factors, such as whether company directors have been buying shares.
How Growth Rates Impact P/E Ratios
Probably the most important factor in determining what P/E a company trades on is the earnings growth. That's because companies that grow earnings per share quickly will rapidly increase the 'E' in the equation. That means unless the share price increases, the P/E will reduce in a few years. Then, a lower P/E should attract more buyers, pushing the share price up.
China Evergrande Group's earnings per share fell by 41% in the last twelve months. But it has grown its earnings per share by 13% per year over the last five years.
Remember: P/E Ratios Don't Consider The Balance Sheet
It's important to note that the P/E ratio considers the market capitalization, not the enterprise value. That means it doesn't take debt or cash into account. In theory, a company can lower its future P/E ratio by using cash or debt to invest in growth.
Spending on growth might be good or bad a few years later, but the point is that the P/E ratio does not account for the option (or lack thereof).
Is Debt Impacting China Evergrande Group's P/E?
China Evergrande Group's net debt is considerable, at 272% of its market cap. If you want to compare its P/E ratio to other companies, you must keep in mind that these debt levels would usually warrant a relatively low P/E.
The Bottom Line On China Evergrande Group's P/E Ratio
China Evergrande Group trades on a P/E ratio of 10.3, which is fairly close to the HK market average of 10.4. With relatively high debt, and no earnings per share growth over twelve months, the P/E suggests that many have an expectation that company will find some growth.
When the market is wrong about a stock, it gives savvy investors an opportunity. As value investor Benjamin Graham famously said, 'In the short run, the market is a voting machine but in the long run, it is a weighing machine. So this free visualization of the analyst consensus on future earnings could help you make the right decision about whether to buy, sell, or hold.
Of course you might be able to find a better stock than China Evergrande Group. So you may wish to see this free collection of other companies that have grown earnings strongly.
If you spot an error that warrants correction, please contact the editor at editorial-team@simplywallst.com. This article by Simply Wall St is general in nature. It does not constitute a recommendation to buy or sell any stock, and does not take account of your objectives, or your financial situation. Simply Wall St has no position in the stocks mentioned.
We aim to bring you long-term focused research analysis driven by fundamental data. Note that our analysis may not factor in the latest price-sensitive company announcements or qualitative material. Thank you for reading.

