Does China Pioneer Pharma Holdings Limited’s (HKG:1345) ROCE Reflect Well On The Business?

Today we'll evaluate China Pioneer Pharma Holdings Limited (HKG:1345) to determine whether it could have potential as an investment idea. In particular, we'll consider its Return On Capital Employed (ROCE), as that can give us insight into how profitably the company is able to employ capital in its business.
First, we'll go over how we calculate ROCE. Then we'll compare its ROCE to similar companies. Finally, we'll look at how its current liabilities affect its ROCE.
Return On Capital Employed (ROCE): What is it?
ROCE is a metric for evaluating how much pre-tax income (in percentage terms) a company earns on the capital invested in its business. In general, businesses with a higher ROCE are usually better quality. In brief, it is a useful tool, but it is not without drawbacks. Author Edwin Whiting says to be careful when comparing the ROCE of different businesses, since 'No two businesses are exactly alike.
How Do You Calculate Return On Capital Employed?
The formula for calculating the return on capital employed is:
Return on Capital Employed = Earnings Before Interest and Tax (EBIT) ÷ (Total Assets - Current Liabilities)
Or for China Pioneer Pharma Holdings:
0.083 = CN¥94m ÷ (CN¥1.4b - CN¥275m) (Based on the trailing twelve months to June 2019.)
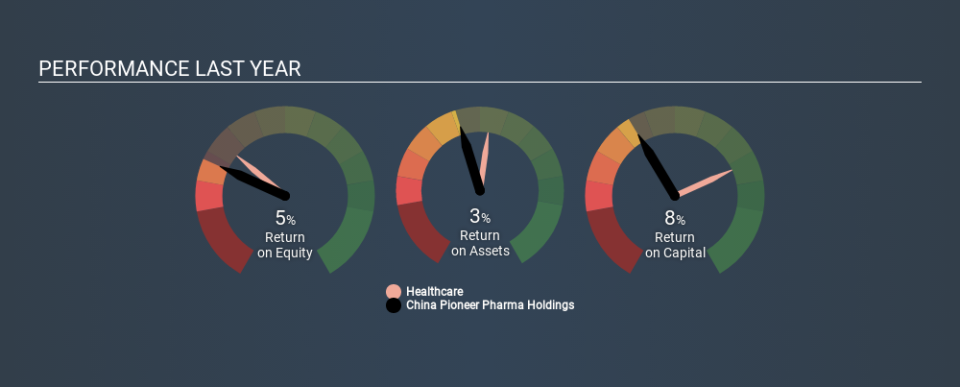
So, China Pioneer Pharma Holdings has an ROCE of 8.3%.
Check out our latest analysis for China Pioneer Pharma Holdings
Is China Pioneer Pharma Holdings's ROCE Good?
When making comparisons between similar businesses, investors may find ROCE useful. We can see China Pioneer Pharma Holdings's ROCE is around the 8.3% average reported by the Healthcare industry. Aside from the industry comparison, China Pioneer Pharma Holdings's ROCE is mediocre in absolute terms, considering the risk of investing in stocks versus the safety of a bank account. Readers may find more attractive investment prospects elsewhere.
China Pioneer Pharma Holdings's current ROCE of 8.3% is lower than its ROCE in the past, which was 20%, 3 years ago. This makes us wonder if the business is facing new challenges. You can see in the image below how China Pioneer Pharma Holdings's ROCE compares to its industry. Click to see more on past growth.
When considering ROCE, bear in mind that it reflects the past and does not necessarily predict the future. ROCE can be deceptive for cyclical businesses, as returns can look incredible in boom times, and terribly low in downturns. ROCE is, after all, simply a snap shot of a single year. You can check if China Pioneer Pharma Holdings has cyclical profits by looking at this free graph of past earnings, revenue and cash flow.
How China Pioneer Pharma Holdings's Current Liabilities Impact Its ROCE
Current liabilities include invoices, such as supplier payments, short-term debt, or a tax bill, that need to be paid within 12 months. Due to the way the ROCE equation works, having large bills due in the near term can make it look as though a company has less capital employed, and thus a higher ROCE than usual. To check the impact of this, we calculate if a company has high current liabilities relative to its total assets.
China Pioneer Pharma Holdings has total assets of CN¥1.4b and current liabilities of CN¥275m. Therefore its current liabilities are equivalent to approximately 20% of its total assets. This is a modest level of current liabilities, which would only have a small effect on ROCE.
What We Can Learn From China Pioneer Pharma Holdings's ROCE
With that in mind, we're not overly impressed with China Pioneer Pharma Holdings's ROCE, so it may not be the most appealing prospect. But note: make sure you look for a great company, not just the first idea you come across. So take a peek at this free list of interesting companies with strong recent earnings growth (and a P/E ratio below 20).
If you like to buy stocks alongside management, then you might just love this free list of companies. (Hint: insiders have been buying them).
If you spot an error that warrants correction, please contact the editor at editorial-team@simplywallst.com. This article by Simply Wall St is general in nature. It does not constitute a recommendation to buy or sell any stock, and does not take account of your objectives, or your financial situation. Simply Wall St has no position in the stocks mentioned.
We aim to bring you long-term focused research analysis driven by fundamental data. Note that our analysis may not factor in the latest price-sensitive company announcements or qualitative material. Thank you for reading.

