How Does China Resources Land Limited's (HKG:1109) Earnings Growth Stack Up Against Industry Performance?

Understanding China Resources Land Limited's (SEHK:1109) performance as a company requires examining more than earnings from one point in time. Today I will take you through a basic sense check to gain perspective on how China Resources Land is doing by evaluating its latest earnings with its longer term trend as well as its industry peers' performance over the same period.
See our latest analysis for China Resources Land
Commentary On 1109's Past Performance
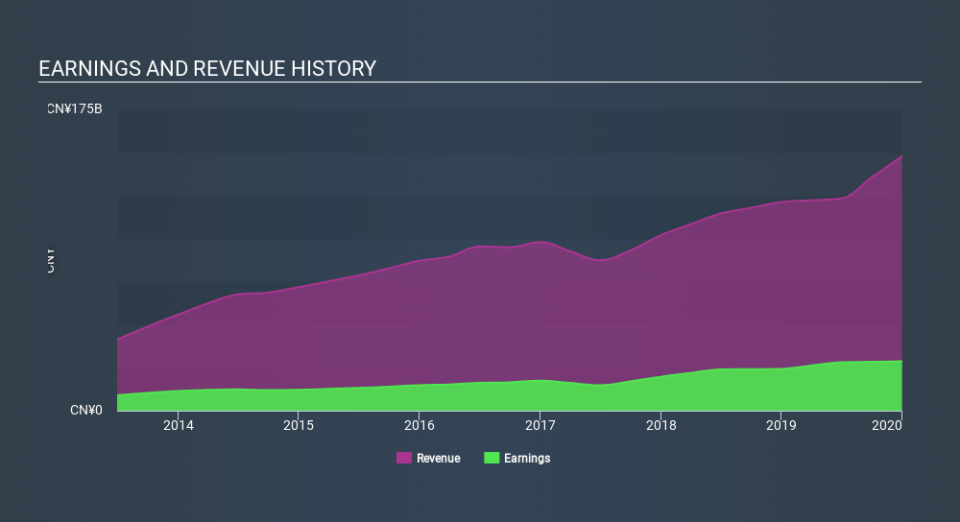
1109's trailing twelve-month earnings (from 31 December 2019) of CN¥29b has jumped 18% compared to the previous year.
Furthermore, this one-year growth rate has exceeded its 5-year annual growth average of 18%, indicating the rate at which 1109 is growing has accelerated. What's the driver of this growth? Well, let’s take a look at if it is solely because of industry tailwinds, or if China Resources Land has seen some company-specific growth.
In terms of returns from investment, China Resources Land has fallen short of achieving a 20% return on equity (ROE), recording 15% instead. However, its return on assets (ROA) of 3.9% exceeds the HK Real Estate industry of 2.9%, indicating China Resources Land has used its assets more efficiently. Though, its return on capital (ROC), which also accounts for China Resources Land’s debt level, has declined over the past 3 years from 14% to 12%.
What does this mean?
China Resources Land's track record can be a valuable insight into its earnings performance, but it certainly doesn't tell the whole story. Positive growth and profitability are what investors like to see in a company’s track record, but how do we properly assess sustainability? I suggest you continue to research China Resources Land to get a more holistic view of the stock by looking at:
Future Outlook: What are well-informed industry analysts predicting for 1109’s future growth? Take a look at our free research report of analyst consensus for 1109’s outlook.
Financial Health: Are 1109’s operations financially sustainable? Balance sheets can be hard to analyze, which is why we’ve done it for you. Check out our financial health checks here.
Other High-Performing Stocks: Are there other stocks that provide better prospects with proven track records? Explore our free list of these great stocks here.
NB: Figures in this article are calculated using data from the trailing twelve months from 31 December 2019. This may not be consistent with full year annual report figures.
If you spot an error that warrants correction, please contact the editor at editorial-team@simplywallst.com. This article by Simply Wall St is general in nature. It does not constitute a recommendation to buy or sell any stock, and does not take account of your objectives, or your financial situation. Simply Wall St has no position in the stocks mentioned.
We aim to bring you long-term focused research analysis driven by fundamental data. Note that our analysis may not factor in the latest price-sensitive company announcements or qualitative material. Thank you for reading.

