How Does Compumedics's (ASX:CMP) P/E Compare To Its Industry, After Its Big Share Price Gain?

Compumedics (ASX:CMP) shares have had a really impressive month, gaining 30%, after some slippage. That brought the twelve month gain to a very sharp 83%.
All else being equal, a sharp share price increase should make a stock less attractive to potential investors. While the market sentiment towards a stock is very changeable, in the long run, the share price will tend to move in the same direction as earnings per share. The implication here is that deep value investors might steer clear when expectations of a company are too high. Perhaps the simplest way to get a read on investors' expectations of a business is to look at its Price to Earnings Ratio (PE Ratio). Investors have optimistic expectations of companies with higher P/E ratios, compared to companies with lower P/E ratios.
See our latest analysis for Compumedics
Does Compumedics Have A Relatively High Or Low P/E For Its Industry?
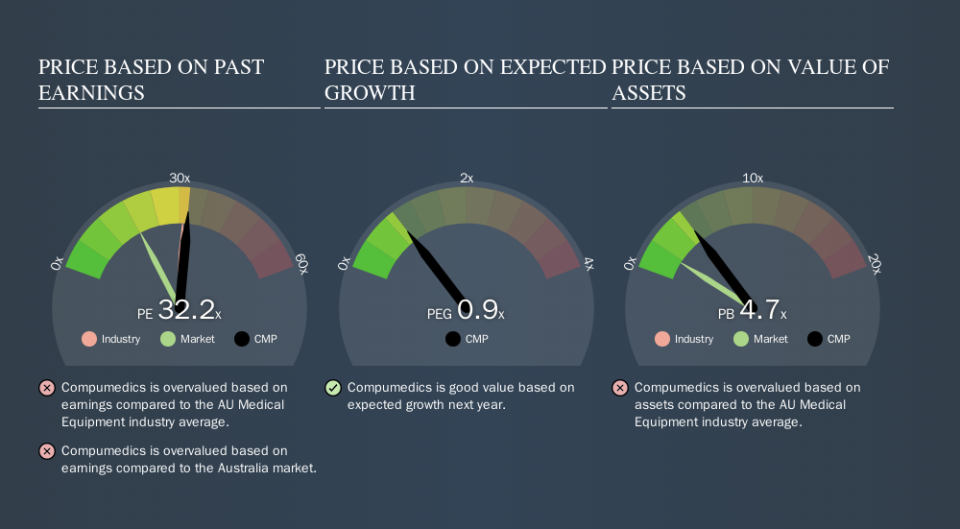
Compumedics's P/E is 32.20. You can see in the image below that the average P/E (30.9) for companies in the medical equipment industry is roughly the same as Compumedics's P/E.
Compumedics's P/E tells us that market participants think its prospects are roughly in line with its industry. If the company has better than average prospects, then the market might be underestimating it. Further research into factors such as insider buying and selling, could help you form your own view on whether that is likely.
How Growth Rates Impact P/E Ratios
Probably the most important factor in determining what P/E a company trades on is the earnings growth. If earnings are growing quickly, then the 'E' in the equation will increase faster than it would otherwise. That means unless the share price increases, the P/E will reduce in a few years. A lower P/E should indicate the stock is cheap relative to others -- and that may attract buyers.
Compumedics increased earnings per share by a whopping 44% last year. And earnings per share have improved by 33% annually, over the last five years. So we'd generally expect it to have a relatively high P/E ratio.
A Limitation: P/E Ratios Ignore Debt and Cash In The Bank
The 'Price' in P/E reflects the market capitalization of the company. Thus, the metric does not reflect cash or debt held by the company. Theoretically, a business can improve its earnings (and produce a lower P/E in the future) by investing in growth. That means taking on debt (or spending its cash).
Spending on growth might be good or bad a few years later, but the point is that the P/E ratio does not account for the option (or lack thereof).
Compumedics's Balance Sheet
Since Compumedics holds net cash of AU$3.0m, it can spend on growth, justifying a higher P/E ratio than otherwise.
The Bottom Line On Compumedics's P/E Ratio
Compumedics's P/E is 32.2 which is above average (18.2) in its market. Its net cash position is the cherry on top of its superb EPS growth. So based on this analysis we'd expect Compumedics to have a high P/E ratio. What we know for sure is that investors have become much more excited about Compumedics recently, since they have pushed its P/E ratio from 24.7 to 32.2 over the last month. For those who prefer to invest with the flow of momentum, that might mean it's time to put the stock on a watchlist, or research it. But the contrarian may see it as a missed opportunity.
Investors have an opportunity when market expectations about a stock are wrong. People often underestimate remarkable growth -- so investors can make money when fast growth is not fully appreciated. So this free visual report on analyst forecasts could hold the key to an excellent investment decision.
Of course you might be able to find a better stock than Compumedics. So you may wish to see this free collection of other companies that have grown earnings strongly.
We aim to bring you long-term focused research analysis driven by fundamental data. Note that our analysis may not factor in the latest price-sensitive company announcements or qualitative material.
If you spot an error that warrants correction, please contact the editor at editorial-team@simplywallst.com. This article by Simply Wall St is general in nature. It does not constitute a recommendation to buy or sell any stock, and does not take account of your objectives, or your financial situation. Simply Wall St has no position in the stocks mentioned. Thank you for reading.
