What Does Coor Service Management Holding AB's (STO:COOR) P/E Ratio Tell You?

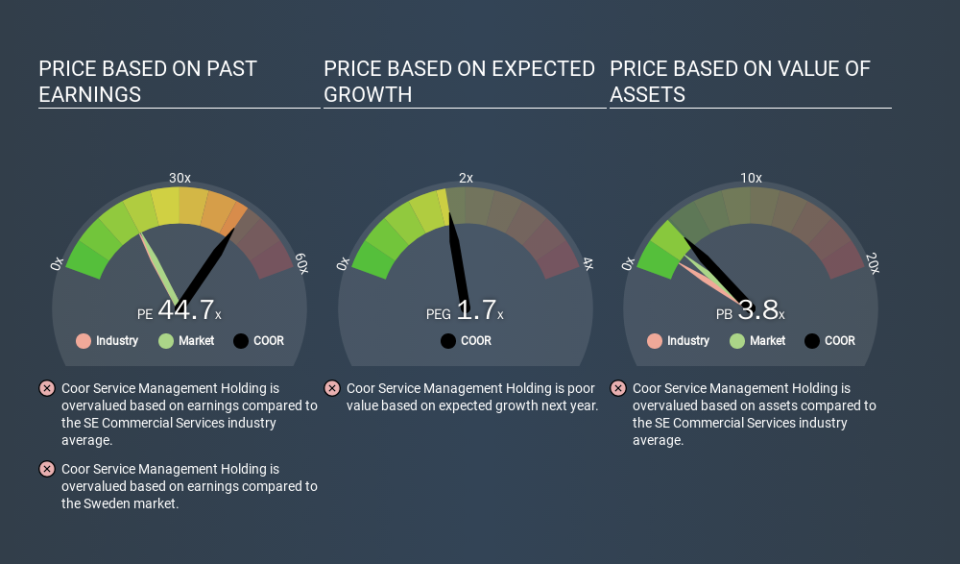
This article is written for those who want to get better at using price to earnings ratios (P/E ratios). We'll look at Coor Service Management Holding AB's (STO:COOR) P/E ratio and reflect on what it tells us about the company's share price. Coor Service Management Holding has a price to earnings ratio of 44.70, based on the last twelve months. That means that at current prices, buyers pay SEK44.70 for every SEK1 in trailing yearly profits.
See our latest analysis for Coor Service Management Holding
How Do You Calculate A P/E Ratio?
The formula for P/E is:
Price to Earnings Ratio = Share Price ÷ Earnings per Share (EPS)
Or for Coor Service Management Holding:
P/E of 44.70 = SEK78.90 ÷ SEK1.77 (Based on the trailing twelve months to September 2019.)
Is A High P/E Ratio Good?
A higher P/E ratio implies that investors pay a higher price for the earning power of the business. That isn't a good or a bad thing on its own, but a high P/E means that buyers have a higher opinion of the business's prospects, relative to stocks with a lower P/E.
How Does Coor Service Management Holding's P/E Ratio Compare To Its Peers?
One good way to get a quick read on what market participants expect of a company is to look at its P/E ratio. The image below shows that Coor Service Management Holding has a higher P/E than the average (17.9) P/E for companies in the commercial services industry.
Coor Service Management Holding's P/E tells us that market participants think the company will perform better than its industry peers, going forward. The market is optimistic about the future, but that doesn't guarantee future growth. So investors should delve deeper. I like to check if company insiders have been buying or selling.
How Growth Rates Impact P/E Ratios
Earnings growth rates have a big influence on P/E ratios. If earnings are growing quickly, then the 'E' in the equation will increase faster than it would otherwise. That means unless the share price increases, the P/E will reduce in a few years. And as that P/E ratio drops, the company will look cheap, unless its share price increases.
In the last year, Coor Service Management Holding grew EPS like Taylor Swift grew her fan base back in 2010; the 55% gain was both fast and well deserved. Having said that, if we look back three years, EPS growth has averaged a comparatively less impressive 12%.
Remember: P/E Ratios Don't Consider The Balance Sheet
It's important to note that the P/E ratio considers the market capitalization, not the enterprise value. So it won't reflect the advantage of cash, or disadvantage of debt. Hypothetically, a company could reduce its future P/E ratio by spending its cash (or taking on debt) to achieve higher earnings.
While growth expenditure doesn't always pay off, the point is that it is a good option to have; but one that the P/E ratio ignores.
Is Debt Impacting Coor Service Management Holding's P/E?
Coor Service Management Holding's net debt is 20% of its market cap. That's enough debt to impact the P/E ratio a little; so keep it in mind if you're comparing it to companies without debt.
The Verdict On Coor Service Management Holding's P/E Ratio
Coor Service Management Holding's P/E is 44.7 which is above average (18.4) in its market. The company is not overly constrained by its modest debt levels, and its recent EPS growth is nothing short of stand-out. So to be frank we are not surprised it has a high P/E ratio.
Investors have an opportunity when market expectations about a stock are wrong. As value investor Benjamin Graham famously said, 'In the short run, the market is a voting machine but in the long run, it is a weighing machine. So this free report on the analyst consensus forecasts could help you make a master move on this stock.
Of course, you might find a fantastic investment by looking at a few good candidates. So take a peek at this free list of companies with modest (or no) debt, trading on a P/E below 20.
If you spot an error that warrants correction, please contact the editor at editorial-team@simplywallst.com. This article by Simply Wall St is general in nature. It does not constitute a recommendation to buy or sell any stock, and does not take account of your objectives, or your financial situation. Simply Wall St has no position in the stocks mentioned.
We aim to bring you long-term focused research analysis driven by fundamental data. Note that our analysis may not factor in the latest price-sensitive company announcements or qualitative material. Thank you for reading.
