What Does CreditAccess Grameen Limited's (NSE:CREDITACC) P/E Ratio Tell You?

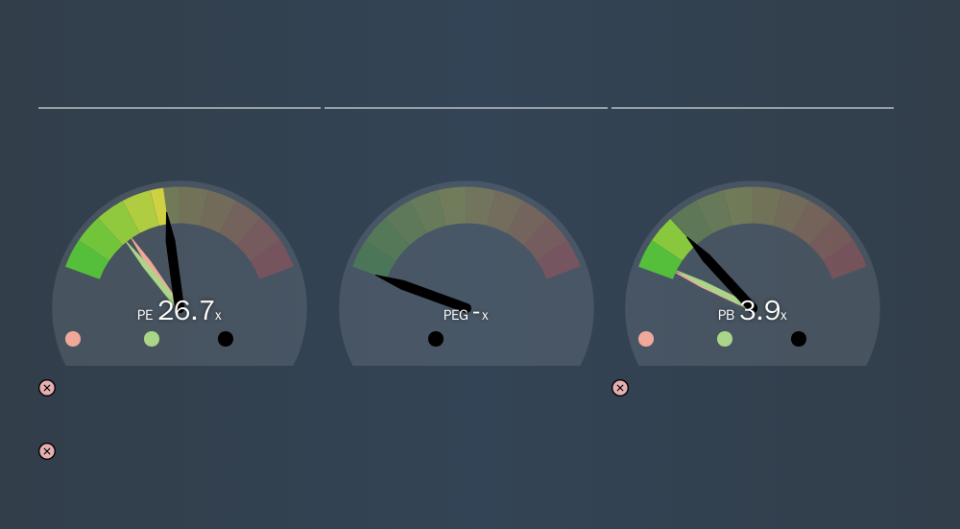
Today, we'll introduce the concept of the P/E ratio for those who are learning about investing. We'll apply a basic P/E ratio analysis to CreditAccess Grameen Limited's (NSE:CREDITACC), to help you decide if the stock is worth further research. What is CreditAccess Grameen's P/E ratio? Well, based on the last twelve months it is 26.72. That means that at current prices, buyers pay ₹26.72 for every ₹1 in trailing yearly profits.
View our latest analysis for CreditAccess Grameen
How Do I Calculate CreditAccess Grameen's Price To Earnings Ratio?
The formula for price to earnings is:
Price to Earnings Ratio = Share Price ÷ Earnings per Share (EPS)
Or for CreditAccess Grameen:
P/E of 26.72 = ₹693.80 ÷ ₹25.97 (Based on the year to September 2019.)
Is A High P/E Ratio Good?
A higher P/E ratio implies that investors pay a higher price for the earning power of the business. That isn't necessarily good or bad, but a high P/E implies relatively high expectations of what a company can achieve in the future.
How Does CreditAccess Grameen's P/E Ratio Compare To Its Peers?
We can get an indication of market expectations by looking at the P/E ratio. As you can see below, CreditAccess Grameen has a higher P/E than the average company (15.2) in the consumer finance industry.
That means that the market expects CreditAccess Grameen will outperform other companies in its industry. The market is optimistic about the future, but that doesn't guarantee future growth. So investors should always consider the P/E ratio alongside other factors, such as whether company directors have been buying shares.
How Growth Rates Impact P/E Ratios
Earnings growth rates have a big influence on P/E ratios. If earnings are growing quickly, then the 'E' in the equation will increase faster than it would otherwise. That means even if the current P/E is high, it will reduce over time if the share price stays flat. Then, a lower P/E should attract more buyers, pushing the share price up.
CreditAccess Grameen's earnings made like a rocket, taking off 66% last year. The cherry on top is that the five year growth rate was an impressive 31% per year. With that kind of growth rate we would generally expect a high P/E ratio.
A Limitation: P/E Ratios Ignore Debt and Cash In The Bank
Don't forget that the P/E ratio considers market capitalization. So it won't reflect the advantage of cash, or disadvantage of debt. Theoretically, a business can improve its earnings (and produce a lower P/E in the future) by investing in growth. That means taking on debt (or spending its cash).
Such expenditure might be good or bad, in the long term, but the point here is that the balance sheet is not reflected by this ratio.
Is Debt Impacting CreditAccess Grameen's P/E?
CreditAccess Grameen has net debt equal to 50% of its market cap. You'd want to be aware of this fact, but it doesn't bother us.
The Bottom Line On CreditAccess Grameen's P/E Ratio
CreditAccess Grameen's P/E is 26.7 which is above average (13.4) in its market. Its debt levels do not imperil its balance sheet and its EPS growth is very healthy indeed. So on this analysis a high P/E ratio seems reasonable.
Investors have an opportunity when market expectations about a stock are wrong. People often underestimate remarkable growth -- so investors can make money when fast growth is not fully appreciated. So this free report on the analyst consensus forecasts could help you make a master move on this stock.
Of course, you might find a fantastic investment by looking at a few good candidates. So take a peek at this free list of companies with modest (or no) debt, trading on a P/E below 20.
We aim to bring you long-term focused research analysis driven by fundamental data. Note that our analysis may not factor in the latest price-sensitive company announcements or qualitative material.
If you spot an error that warrants correction, please contact the editor at editorial-team@simplywallst.com. This article by Simply Wall St is general in nature. It does not constitute a recommendation to buy or sell any stock, and does not take account of your objectives, or your financial situation. Simply Wall St has no position in the stocks mentioned. Thank you for reading.

