What Does CRISIL Limited's (NSE:CRISIL) P/E Ratio Tell You?

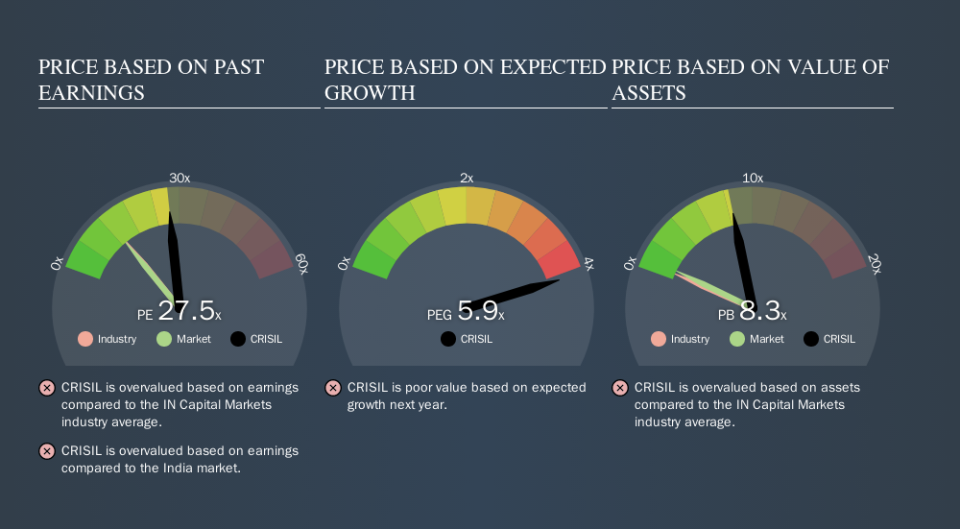
The goal of this article is to teach you how to use price to earnings ratios (P/E ratios). We'll apply a basic P/E ratio analysis to CRISIL Limited's (NSE:CRISIL), to help you decide if the stock is worth further research. Based on the last twelve months, CRISIL's P/E ratio is 27.52. In other words, at today's prices, investors are paying ₹27.52 for every ₹1 in prior year profit.
View our latest analysis for CRISIL
How Do I Calculate CRISIL's Price To Earnings Ratio?
The formula for price to earnings is:
Price to Earnings Ratio = Price per Share ÷ Earnings per Share (EPS)
Or for CRISIL:
P/E of 27.52 = ₹1324.80 ÷ ₹48.15 (Based on the year to June 2019.)
Is A High Price-to-Earnings Ratio Good?
The higher the P/E ratio, the higher the price tag of a business, relative to its trailing earnings. That isn't a good or a bad thing on its own, but a high P/E means that buyers have a higher opinion of the business's prospects, relative to stocks with a lower P/E.
Does CRISIL Have A Relatively High Or Low P/E For Its Industry?
The P/E ratio essentially measures market expectations of a company. As you can see below, CRISIL has a higher P/E than the average company (13.4) in the capital markets industry.
CRISIL's P/E tells us that market participants think the company will perform better than its industry peers, going forward. Shareholders are clearly optimistic, but the future is always uncertain. So further research is always essential. I often monitor director buying and selling.
How Growth Rates Impact P/E Ratios
P/E ratios primarily reflect market expectations around earnings growth rates. When earnings grow, the 'E' increases, over time. Therefore, even if you pay a high multiple of earnings now, that multiple will become lower in the future. Then, a lower P/E should attract more buyers, pushing the share price up.
CRISIL's earnings per share grew by -6.4% in the last twelve months. And it has bolstered its earnings per share by 1.6% per year over the last five years.
A Limitation: P/E Ratios Ignore Debt and Cash In The Bank
One drawback of using a P/E ratio is that it considers market capitalization, but not the balance sheet. So it won't reflect the advantage of cash, or disadvantage of debt. The exact same company would hypothetically deserve a higher P/E ratio if it had a strong balance sheet, than if it had a weak one with lots of debt, because a cashed up company can spend on growth.
While growth expenditure doesn't always pay off, the point is that it is a good option to have; but one that the P/E ratio ignores.
So What Does CRISIL's Balance Sheet Tell Us?
The extra options and safety that comes with CRISIL's ₹4.7b net cash position means that it deserves a higher P/E than it would if it had a lot of net debt.
The Verdict On CRISIL's P/E Ratio
CRISIL has a P/E of 27.5. That's higher than the average in its market, which is 13.2. Recent earnings growth wasn't bad. And the net cash position provides the company with multiple options. The high P/E suggests the market thinks further growth will come.
Investors have an opportunity when market expectations about a stock are wrong. As value investor Benjamin Graham famously said, 'In the short run, the market is a voting machine but in the long run, it is a weighing machine. So this free report on the analyst consensus forecasts could help you make a master move on this stock.
Of course, you might find a fantastic investment by looking at a few good candidates. So take a peek at this free list of companies with modest (or no) debt, trading on a P/E below 20.
We aim to bring you long-term focused research analysis driven by fundamental data. Note that our analysis may not factor in the latest price-sensitive company announcements or qualitative material.
If you spot an error that warrants correction, please contact the editor at editorial-team@simplywallst.com. This article by Simply Wall St is general in nature. It does not constitute a recommendation to buy or sell any stock, and does not take account of your objectives, or your financial situation. Simply Wall St has no position in the stocks mentioned. Thank you for reading.

