Does CSI Properties Limited's (HKG:497) P/E Ratio Signal A Buying Opportunity?

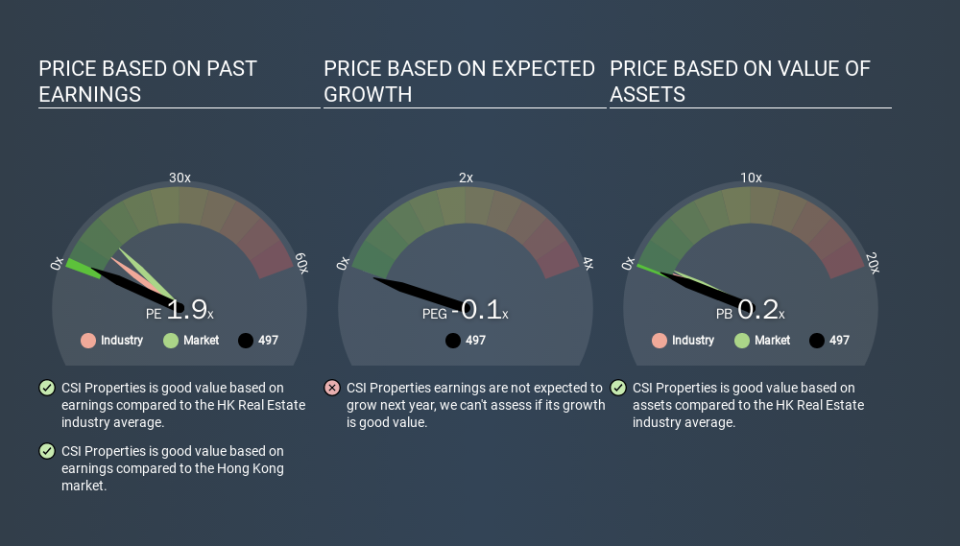
Today, we'll introduce the concept of the P/E ratio for those who are learning about investing. We'll show how you can use CSI Properties Limited's (HKG:497) P/E ratio to inform your assessment of the investment opportunity. Looking at earnings over the last twelve months, CSI Properties has a P/E ratio of 1.89. That is equivalent to an earnings yield of about 52.8%.
See our latest analysis for CSI Properties
How Do You Calculate A P/E Ratio?
The formula for price to earnings is:
Price to Earnings Ratio = Share Price ÷ Earnings per Share (EPS)
Or for CSI Properties:
P/E of 1.89 = HKD0.32 ÷ HKD0.17 (Based on the year to September 2019.)
Is A High Price-to-Earnings Ratio Good?
A higher P/E ratio means that investors are paying a higher price for each HKD1 of company earnings. That isn't a good or a bad thing on its own, but a high P/E means that buyers have a higher opinion of the business's prospects, relative to stocks with a lower P/E.
How Does CSI Properties's P/E Ratio Compare To Its Peers?
We can get an indication of market expectations by looking at the P/E ratio. If you look at the image below, you can see CSI Properties has a lower P/E than the average (7.0) in the real estate industry classification.
CSI Properties's P/E tells us that market participants think it will not fare as well as its peers in the same industry. Since the market seems unimpressed with CSI Properties, it's quite possible it could surprise on the upside. You should delve deeper. I like to check if company insiders have been buying or selling.
How Growth Rates Impact P/E Ratios
Generally speaking the rate of earnings growth has a profound impact on a company's P/E multiple. Earnings growth means that in the future the 'E' will be higher. That means unless the share price increases, the P/E will reduce in a few years. And as that P/E ratio drops, the company will look cheap, unless its share price increases.
CSI Properties increased earnings per share by a whopping 45% last year. And its annual EPS growth rate over 5 years is 33%. So we'd generally expect it to have a relatively high P/E ratio.
A Limitation: P/E Ratios Ignore Debt and Cash In The Bank
It's important to note that the P/E ratio considers the market capitalization, not the enterprise value. In other words, it does not consider any debt or cash that the company may have on the balance sheet. The exact same company would hypothetically deserve a higher P/E ratio if it had a strong balance sheet, than if it had a weak one with lots of debt, because a cashed up company can spend on growth.
While growth expenditure doesn't always pay off, the point is that it is a good option to have; but one that the P/E ratio ignores.
Is Debt Impacting CSI Properties's P/E?
CSI Properties's net debt is considerable, at 196% of its market cap. This level of debt justifies a relatively low P/E, so remain cognizant of the debt, if you're comparing it to other stocks.
The Bottom Line On CSI Properties's P/E Ratio
CSI Properties trades on a P/E ratio of 1.9, which is below the HK market average of 10.6. While the EPS growth last year was strong, the significant debt levels reduce the number of options available to management. If it continues to grow, then the current low P/E may prove to be unjustified.
Investors have an opportunity when market expectations about a stock are wrong. As value investor Benjamin Graham famously said, 'In the short run, the market is a voting machine but in the long run, it is a weighing machine. So this free visual report on analyst forecasts could hold the key to an excellent investment decision.
But note: CSI Properties may not be the best stock to buy. So take a peek at this free list of interesting companies with strong recent earnings growth (and a P/E ratio below 20).
If you spot an error that warrants correction, please contact the editor at editorial-team@simplywallst.com. This article by Simply Wall St is general in nature. It does not constitute a recommendation to buy or sell any stock, and does not take account of your objectives, or your financial situation. Simply Wall St has no position in the stocks mentioned.
We aim to bring you long-term focused research analysis driven by fundamental data. Note that our analysis may not factor in the latest price-sensitive company announcements or qualitative material. Thank you for reading.
