What Does Cubex Tubings Limited's (NSE:CUBEXTUB) P/E Ratio Tell You?

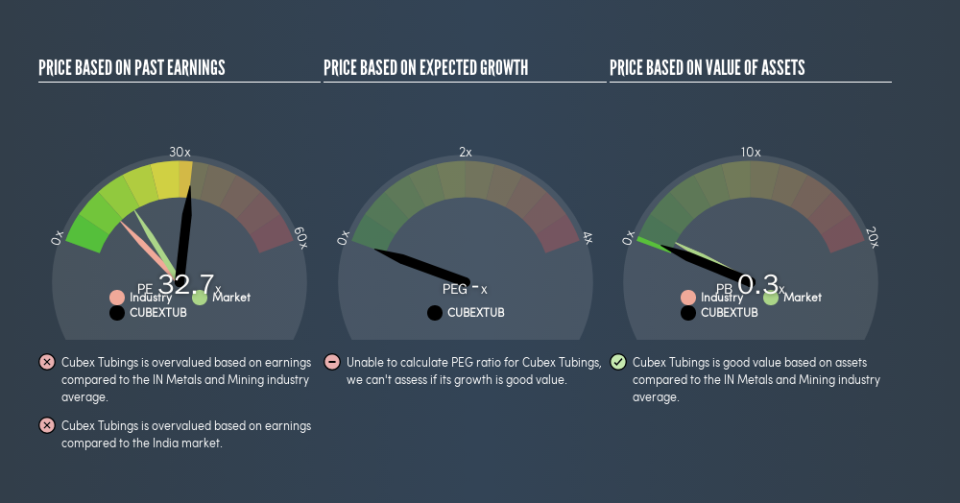
This article is written for those who want to get better at using price to earnings ratios (P/E ratios). We'll apply a basic P/E ratio analysis to Cubex Tubings Limited's (NSE:CUBEXTUB), to help you decide if the stock is worth further research. Looking at earnings over the last twelve months, Cubex Tubings has a P/E ratio of 32.69. In other words, at today's prices, investors are paying ₹32.69 for every ₹1 in prior year profit.
View our latest analysis for Cubex Tubings
How Do I Calculate A Price To Earnings Ratio?
The formula for P/E is:
Price to Earnings Ratio = Price per Share ÷ Earnings per Share (EPS)
Or for Cubex Tubings:
P/E of 32.69 = ₹14.3 ÷ ₹0.44 (Based on the trailing twelve months to December 2018.)
Is A High Price-to-Earnings Ratio Good?
A higher P/E ratio implies that investors pay a higher price for the earning power of the business. All else being equal, it's better to pay a low price -- but as Warren Buffett said, 'It's far better to buy a wonderful company at a fair price than a fair company at a wonderful price.'
How Growth Rates Impact P/E Ratios
Probably the most important factor in determining what P/E a company trades on is the earnings growth. That's because companies that grow earnings per share quickly will rapidly increase the 'E' in the equation. Therefore, even if you pay a high multiple of earnings now, that multiple will become lower in the future. A lower P/E should indicate the stock is cheap relative to others -- and that may attract buyers.
Cubex Tubings increased earnings per share by a whopping 39% last year. And it has improved its earnings per share by 53% per year over the last three years. I'd therefore be a little surprised if its P/E ratio was not relatively high.
Does Cubex Tubings Have A Relatively High Or Low P/E For Its Industry?
One good way to get a quick read on what market participants expect of a company is to look at its P/E ratio. As you can see below, Cubex Tubings has a higher P/E than the average company (11.1) in the metals and mining industry.
Cubex Tubings's P/E tells us that market participants think the company will perform better than its industry peers, going forward. Shareholders are clearly optimistic, but the future is always uncertain. So investors should delve deeper. I like to check if company insiders have been buying or selling.
A Limitation: P/E Ratios Ignore Debt and Cash In The Bank
The 'Price' in P/E reflects the market capitalization of the company. In other words, it does not consider any debt or cash that the company may have on the balance sheet. In theory, a company can lower its future P/E ratio by using cash or debt to invest in growth.
Spending on growth might be good or bad a few years later, but the point is that the P/E ratio does not account for the option (or lack thereof).
Cubex Tubings's Balance Sheet
Cubex Tubings's net debt is 23% of its market cap. That's enough debt to impact the P/E ratio a little; so keep it in mind if you're comparing it to companies without debt.
The Verdict On Cubex Tubings's P/E Ratio
Cubex Tubings trades on a P/E ratio of 32.7, which is above the IN market average of 16.2. Its debt levels do not imperil its balance sheet and its EPS growth is very healthy indeed. So to be frank we are not surprised it has a high P/E ratio.
Investors have an opportunity when market expectations about a stock are wrong. As value investor Benjamin Graham famously said, 'In the short run, the market is a voting machine but in the long run, it is a weighing machine.' Although we don't have analyst forecasts, shareholders might want to examine this detailed historical graph of earnings, revenue and cash flow.
You might be able to find a better buy than Cubex Tubings. If you want a selection of possible winners, check out this free list of interesting companies that trade on a P/E below 20 (but have proven they can grow earnings).
We aim to bring you long-term focused research analysis driven by fundamental data. Note that our analysis may not factor in the latest price-sensitive company announcements or qualitative material.
If you spot an error that warrants correction, please contact the editor at editorial-team@simplywallst.com. This article by Simply Wall St is general in nature. It does not constitute a recommendation to buy or sell any stock, and does not take account of your objectives, or your financial situation. Simply Wall St has no position in the stocks mentioned. Thank you for reading.