Does Dragon Rise Group Holdings Limited (HKG:6829) Have A Good P/E Ratio?

Want to participate in a short research study? Help shape the future of investing tools and receive a $20 prize!
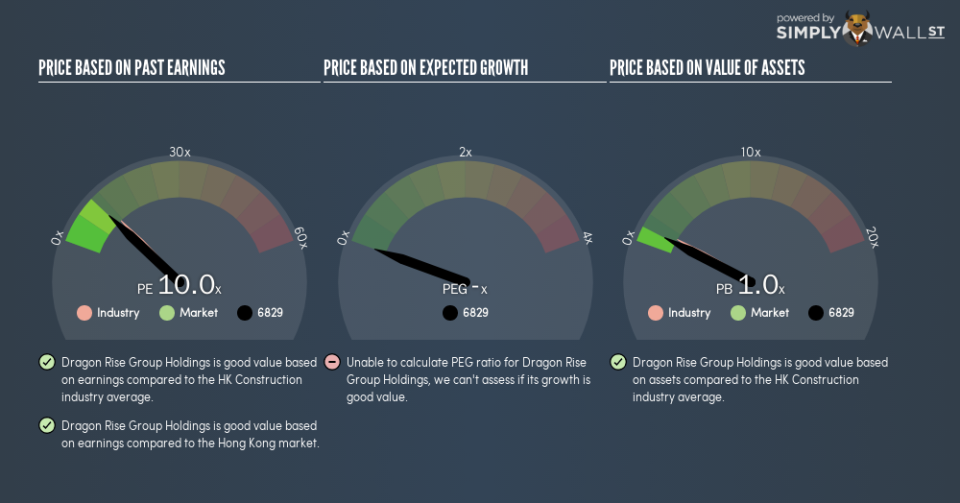
This article is for investors who would like to improve their understanding of price to earnings ratios (P/E ratios). We’ll show how you can use Dragon Rise Group Holdings Limited’s (HKG:6829) P/E ratio to inform your assessment of the investment opportunity. Dragon Rise Group Holdings has a P/E ratio of 10.03, based on the last twelve months. In other words, at today’s prices, investors are paying HK$10.03 for every HK$1 in prior year profit.
Check out our latest analysis for Dragon Rise Group Holdings
How Do I Calculate A Price To Earnings Ratio?
The formula for price to earnings is:
Price to Earnings Ratio = Share Price ÷ Earnings per Share (EPS)
Or for Dragon Rise Group Holdings:
P/E of 10.03 = HK$0.25 ÷ HK$0.025 (Based on the year to September 2018.)
Is A High Price-to-Earnings Ratio Good?
A higher P/E ratio means that buyers have to pay a higher price for each HK$1 the company has earned over the last year. That isn’t necessarily good or bad, but a high P/E implies relatively high expectations of what a company can achieve in the future.
How Growth Rates Impact P/E Ratios
P/E ratios primarily reflect market expectations around earnings growth rates. That’s because companies that grow earnings per share quickly will rapidly increase the ‘E’ in the equation. That means even if the current P/E is high, it will reduce over time if the share price stays flat. A lower P/E should indicate the stock is cheap relative to others — and that may attract buyers.
Dragon Rise Group Holdings saw earnings per share decrease by 61% last year. But EPS is up 10.0% over the last 5 years.
How Does Dragon Rise Group Holdings’s P/E Ratio Compare To Its Peers?
The P/E ratio indicates whether the market has higher or lower expectations of a company. If you look at the image below, you can see Dragon Rise Group Holdings has a lower P/E than the average (11.6) in the construction industry classification.
Dragon Rise Group Holdings’s P/E tells us that market participants think it will not fare as well as its peers in the same industry. Many investors like to buy stocks when the market is pessimistic about their prospects. If you consider the stock interesting, further research is recommended. For example, I often monitor director buying and selling.
A Limitation: P/E Ratios Ignore Debt and Cash In The Bank
The ‘Price’ in P/E reflects the market capitalization of the company. In other words, it does not consider any debt or cash that the company may have on the balance sheet. In theory, a company can lower its future P/E ratio by using cash or debt to invest in growth.
Spending on growth might be good or bad a few years later, but the point is that the P/E ratio does not account for the option (or lack thereof).
How Does Dragon Rise Group Holdings’s Debt Impact Its P/E Ratio?
Dragon Rise Group Holdings has net cash of HK$84m. That should lead to a higher P/E than if it did have debt, because its strong balance sheets gives it more options.
The Verdict On Dragon Rise Group Holdings’s P/E Ratio
Dragon Rise Group Holdings trades on a P/E ratio of 10, which is fairly close to the HK market average of 10.7. Although the recent drop in earnings per share would keep the market cautious, the healthy balance sheet means the company retains potential for future growth. So it’s not surprising to see it trade on a P/E roughly in line with the market.
Investors should be looking to buy stocks that the market is wrong about. If it is underestimating a company, investors can make money by buying and holding the shares until the market corrects itself. Although we don’t have analyst forecasts, you might want to assess this data-rich visualization of earnings, revenue and cash flow.
Of course, you might find a fantastic investment by looking at a few good candidates. So take a peek at this free list of companies with modest (or no) debt, trading on a P/E below 20.
We aim to bring you long-term focused research analysis driven by fundamental data. Note that our analysis may not factor in the latest price-sensitive company announcements or qualitative material.
If you spot an error that warrants correction, please contact the editor at editorial-team@simplywallst.com. This article by Simply Wall St is general in nature. It does not constitute a recommendation to buy or sell any stock, and does not take account of your objectives, or your financial situation. Simply Wall St has no position in the stocks mentioned. On rare occasion, data errors may occur. Thank you for reading.

