Does E2E Networks Limited's (NSE:E2E) P/E Ratio Signal A Buying Opportunity?

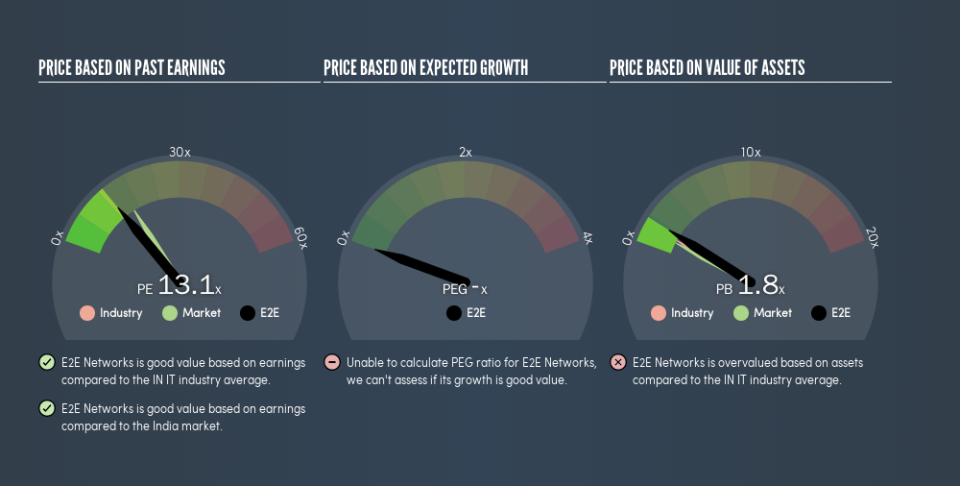
This article is for investors who would like to improve their understanding of price to earnings ratios (P/E ratios). We'll apply a basic P/E ratio analysis to E2E Networks Limited's (NSE:E2E), to help you decide if the stock is worth further research. Looking at earnings over the last twelve months, E2E Networks has a P/E ratio of 13.1. That corresponds to an earnings yield of approximately 7.6%.
View our latest analysis for E2E Networks
How Do You Calculate A P/E Ratio?
The formula for P/E is:
Price to Earnings Ratio = Price per Share ÷ Earnings per Share (EPS)
Or for E2E Networks:
P/E of 13.1 = ₹44.7 ÷ ₹3.41 (Based on the year to September 2018.)
Is A High Price-to-Earnings Ratio Good?
The higher the P/E ratio, the higher the price tag of a business, relative to its trailing earnings. That is not a good or a bad thing per se, but a high P/E does imply buyers are optimistic about the future.
How Growth Rates Impact P/E Ratios
Generally speaking the rate of earnings growth has a profound impact on a company's P/E multiple. That's because companies that grow earnings per share quickly will rapidly increase the 'E' in the equation. Therefore, even if you pay a high multiple of earnings now, that multiple will become lower in the future. A lower P/E should indicate the stock is cheap relative to others -- and that may attract buyers.
E2E Networks shrunk earnings per share by 34% over the last year. But over the longer term (5 years) earnings per share have increased by 69%.
How Does E2E Networks's P/E Ratio Compare To Its Peers?
One good way to get a quick read on what market participants expect of a company is to look at its P/E ratio. We can see in the image below that the average P/E (15.7) for companies in the it industry is higher than E2E Networks's P/E.
E2E Networks's P/E tells us that market participants think it will not fare as well as its peers in the same industry. Since the market seems unimpressed with E2E Networks, it's quite possible it could surprise on the upside. You should delve deeper. I like to check if company insiders have been buying or selling.
Remember: P/E Ratios Don't Consider The Balance Sheet
The 'Price' in P/E reflects the market capitalization of the company. In other words, it does not consider any debt or cash that the company may have on the balance sheet. Theoretically, a business can improve its earnings (and produce a lower P/E in the future) by investing in growth. That means taking on debt (or spending its cash).
Such spending might be good or bad, overall, but the key point here is that you need to look at debt to understand the P/E ratio in context.
Is Debt Impacting E2E Networks's P/E?
With net cash of ₹249m, E2E Networks has a very strong balance sheet, which may be important for its business. Having said that, at 36% of its market capitalization the cash hoard would contribute towards a higher P/E ratio.
The Bottom Line On E2E Networks's P/E Ratio
E2E Networks trades on a P/E ratio of 13.1, which is below the IN market average of 16. The recent drop in earnings per share would almost certainly temper expectations, the healthy balance sheet means the company retains potential for future growth. If that occurs, the current low P/E could prove to be temporary.
Investors should be looking to buy stocks that the market is wrong about. If the reality for a company is not as bad as the P/E ratio indicates, then the share price should increase as the market realizes this. We don't have analyst forecasts, but you might want to assess this data-rich visualization of earnings, revenue and cash flow.
Of course, you might find a fantastic investment by looking at a few good candidates. So take a peek at this free list of companies with modest (or no) debt, trading on a P/E below 20.
We aim to bring you long-term focused research analysis driven by fundamental data. Note that our analysis may not factor in the latest price-sensitive company announcements or qualitative material.
If you spot an error that warrants correction, please contact the editor at editorial-team@simplywallst.com. This article by Simply Wall St is general in nature. It does not constitute a recommendation to buy or sell any stock, and does not take account of your objectives, or your financial situation. Simply Wall St has no position in the stocks mentioned. Thank you for reading.

