What does Electricité de France S.A.'s (EPA:EDF) Balance Sheet Tell Us About Its Future?

There are a number of reasons that attract investors towards large-cap companies such as Electricité de France S.A. (EPA:EDF), with a market cap of €38b. Market participants who are conscious of risk tend to search for large firms, attracted by the prospect of varied revenue sources and strong returns on capital. However, its financial health remains the key to continued success. I will provide an overview of Electricité de France’s financial liquidity and leverage to give you an idea of Electricité de France’s position to take advantage of potential acquisitions or comfortably endure future downturns. Remember this is a very top-level look that focuses exclusively on financial health, so I recommend a deeper analysis into EDF here.
Want to participate in a short research study? Help shape the future of investing tools and you could win a $250 gift card!
View our latest analysis for Electricité de France
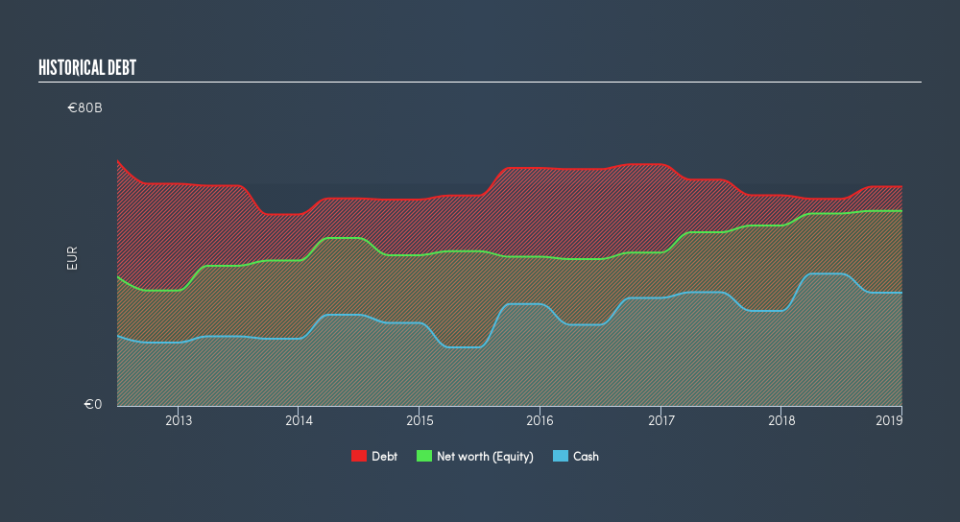
EDF’s Debt (And Cash Flows)
Over the past year, EDF has maintained its debt levels at around €59b including long-term debt. At this current level of debt, the current cash and short-term investment levels stands at €31b , ready to be used for running the business. On top of this, EDF has generated cash from operations of €13b in the last twelve months, resulting in an operating cash to total debt ratio of 23%, meaning that EDF’s debt is appropriately covered by operating cash.
Does EDF’s liquid assets cover its short-term commitments?
At the current liabilities level of €53b, it seems that the business has been able to meet these commitments with a current assets level of €73b, leading to a 1.38x current account ratio. The current ratio is calculated by dividing current assets by current liabilities. Usually, for Electric Utilities companies, this is a suitable ratio since there is a bit of a cash buffer without leaving too much capital in a low-return environment.
Can EDF service its debt comfortably?
Considering Electricité de France’s total debt outweighs its equity, the company is deemed highly levered. This isn’t surprising for large-caps, as equity can often be more expensive to issue than debt, plus interest payments are tax deductible. Accordingly, large companies often have an advantage over small-caps through lower cost of capital due to cheaper financing. We can assess the sustainability of EDF’s debt levels to the test by looking at how well interest payments are covered by earnings. Net interest should be covered by earnings before interest and tax (EBIT) by at least three times to be safe. In EDF's case, the ratio of 5.94x suggests that interest is well-covered. High interest coverage serves as an indication of the safety of a company, which highlights why many large organisations like EDF are considered a risk-averse investment.
Next Steps:
EDF’s debt and cash flow levels indicate room for improvement. Its cash flow coverage of less than a quarter of debt means that operating efficiency could be an issue. Though, the company exhibits an ability to meet its near-term obligations, which isn't a big surprise for a large-cap. Keep in mind I haven't considered other factors such as how EDF has been performing in the past. I recommend you continue to research Electricité de France to get a better picture of the stock by looking at:
Future Outlook: What are well-informed industry analysts predicting for EDF’s future growth? Take a look at our free research report of analyst consensus for EDF’s outlook.
Valuation: What is EDF worth today? Is the stock undervalued, even when its growth outlook is factored into its intrinsic value? The intrinsic value infographic in our free research report helps visualize whether EDF is currently mispriced by the market.
Other High-Performing Stocks: Are there other stocks that provide better prospects with proven track records? Explore our free list of these great stocks here.
We aim to bring you long-term focused research analysis driven by fundamental data. Note that our analysis may not factor in the latest price-sensitive company announcements or qualitative material.
If you spot an error that warrants correction, please contact the editor at editorial-team@simplywallst.com. This article by Simply Wall St is general in nature. It does not constitute a recommendation to buy or sell any stock, and does not take account of your objectives, or your financial situation. Simply Wall St has no position in the stocks mentioned. Thank you for reading.
