What Does Energiekontor AG's (FRA:EKT) P/E Ratio Tell You?

Want to participate in a short research study? Help shape the future of investing tools and you could win a $250 gift card!
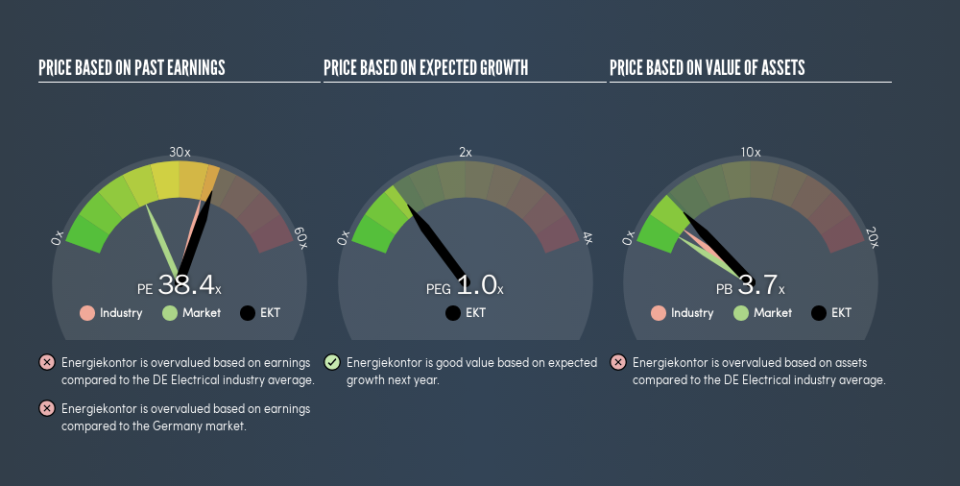
This article is for investors who would like to improve their understanding of price to earnings ratios (P/E ratios). We'll show how you can use Energiekontor AG's (FRA:EKT) P/E ratio to inform your assessment of the investment opportunity. Energiekontor has a price to earnings ratio of 38.39, based on the last twelve months. That means that at current prices, buyers pay €38.39 for every €1 in trailing yearly profits.
View our latest analysis for Energiekontor
How Do I Calculate A Price To Earnings Ratio?
The formula for price to earnings is:
Price to Earnings Ratio = Price per Share ÷ Earnings per Share (EPS)
Or for Energiekontor:
P/E of 38.39 = €17.6 ÷ €0.46 (Based on the trailing twelve months to December 2018.)
Is A High Price-to-Earnings Ratio Good?
The higher the P/E ratio, the higher the price tag of a business, relative to its trailing earnings. All else being equal, it's better to pay a low price -- but as Warren Buffett said, 'It's far better to buy a wonderful company at a fair price than a fair company at a wonderful price.'
Does Energiekontor Have A Relatively High Or Low P/E For Its Industry?
The P/E ratio indicates whether the market has higher or lower expectations of a company. The image below shows that Energiekontor has a P/E ratio that is roughly in line with the electrical industry average (36.1).
That indicates that the market expects Energiekontor will perform roughly in line with other companies in its industry. If the company has better than average prospects, then the market might be underestimating it. Further research into factors such as insider buying and selling, could help you form your own view on whether that is likely.
How Growth Rates Impact P/E Ratios
Companies that shrink earnings per share quickly will rapidly decrease the 'E' in the equation. That means unless the share price falls, the P/E will increase in a few years. Then, a higher P/E might scare off shareholders, pushing the share price down.
Energiekontor's earnings per share fell by 44% in the last twelve months. And EPS is down 13% a year, over the last 5 years. This growth rate might warrant a below average P/E ratio.
A Limitation: P/E Ratios Ignore Debt and Cash In The Bank
One drawback of using a P/E ratio is that it considers market capitalization, but not the balance sheet. That means it doesn't take debt or cash into account. In theory, a company can lower its future P/E ratio by using cash or debt to invest in growth.
Spending on growth might be good or bad a few years later, but the point is that the P/E ratio does not account for the option (or lack thereof).
Energiekontor's Balance Sheet
Energiekontor's net debt is 58% of its market cap. This is a reasonably significant level of debt -- all else being equal you'd expect a much lower P/E than if it had net cash.
The Verdict On Energiekontor's P/E Ratio
Energiekontor has a P/E of 38.4. That's higher than the average in its market, which is 20.1. With meaningful debt and a lack of recent earnings growth, the market has high expectations that the business will earn more in the future.
When the market is wrong about a stock, it gives savvy investors an opportunity. If the reality for a company is better than it expects, you can make money by buying and holding for the long term. So this free visualization of the analyst consensus on future earnings could help you make the right decision about whether to buy, sell, or hold.
But note: Energiekontor may not be the best stock to buy. So take a peek at this free list of interesting companies with strong recent earnings growth (and a P/E ratio below 20).
We aim to bring you long-term focused research analysis driven by fundamental data. Note that our analysis may not factor in the latest price-sensitive company announcements or qualitative material.
If you spot an error that warrants correction, please contact the editor at editorial-team@simplywallst.com. This article by Simply Wall St is general in nature. It does not constitute a recommendation to buy or sell any stock, and does not take account of your objectives, or your financial situation. Simply Wall St has no position in the stocks mentioned. Thank you for reading.
