Does Epsilon Net S.A. (ATH:EPSIL) Create Value For Shareholders?

Want to participate in a short research study? Help shape the future of investing tools and you could win a $250 gift card!
Today we are going to look at Epsilon Net S.A. (ATH:EPSIL) to see whether it might be an attractive investment prospect. Specifically, we're going to calculate its Return On Capital Employed (ROCE), in the hopes of getting some insight into the business.
First up, we'll look at what ROCE is and how we calculate it. Then we'll compare its ROCE to similar companies. Last but not least, we'll look at what impact its current liabilities have on its ROCE.
Understanding Return On Capital Employed (ROCE)
ROCE is a metric for evaluating how much pre-tax income (in percentage terms) a company earns on the capital invested in its business. All else being equal, a better business will have a higher ROCE. Overall, it is a valuable metric that has its flaws. Renowned investment researcher Michael Mauboussin has suggested that a high ROCE can indicate that 'one dollar invested in the company generates value of more than one dollar'.
How Do You Calculate Return On Capital Employed?
The formula for calculating the return on capital employed is:
Return on Capital Employed = Earnings Before Interest and Tax (EBIT) ÷ (Total Assets - Current Liabilities)
Or for Epsilon Net:
0.077 = €1.4m ÷ (€24m - €5.0m) (Based on the trailing twelve months to December 2018.)
Therefore, Epsilon Net has an ROCE of 7.7%.
View our latest analysis for Epsilon Net
Does Epsilon Net Have A Good ROCE?
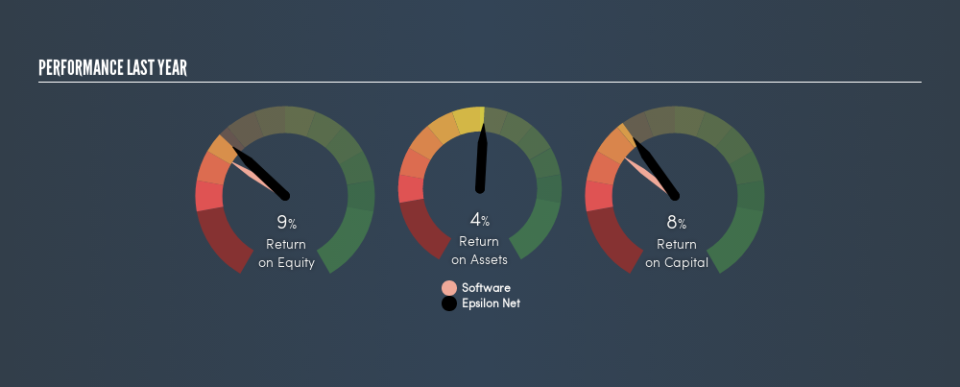
ROCE can be useful when making comparisons, such as between similar companies. We can see Epsilon Net's ROCE is around the 7.7% average reported by the Software industry. Independently of how Epsilon Net compares to its industry, its ROCE in absolute terms is low; especially compared to the ~4.9% available in government bonds. It is likely that there are more attractive prospects out there.
We can see that , Epsilon Net currently has an ROCE of 7.7% compared to its ROCE 3 years ago, which was 5.7%. This makes us think the business might be improving. You can click on the image below to see (in greater detail) how Epsilon Net's past growth compares to other companies.
It is important to remember that ROCE shows past performance, and is not necessarily predictive. ROCE can be misleading for companies in cyclical industries, with returns looking impressive during the boom times, but very weak during the busts. ROCE is only a point-in-time measure. How cyclical is Epsilon Net? You can see for yourself by looking at this free graph of past earnings, revenue and cash flow.
How Epsilon Net's Current Liabilities Impact Its ROCE
Liabilities, such as supplier bills and bank overdrafts, are referred to as current liabilities if they need to be paid within 12 months. The ROCE equation subtracts current liabilities from capital employed, so a company with a lot of current liabilities appears to have less capital employed, and a higher ROCE than otherwise. To check the impact of this, we calculate if a company has high current liabilities relative to its total assets.
Epsilon Net has total liabilities of €5.0m and total assets of €24m. As a result, its current liabilities are equal to approximately 21% of its total assets. With a very reasonable level of current liabilities, so the impact on ROCE is fairly minimal.
What We Can Learn From Epsilon Net's ROCE
While that is good to see, Epsilon Net has a low ROCE and does not look attractive in this analysis. But note: make sure you look for a great company, not just the first idea you come across. So take a peek at this free list of interesting companies with strong recent earnings growth (and a P/E ratio below 20).
If you like to buy stocks alongside management, then you might just love this free list of companies. (Hint: insiders have been buying them).
We aim to bring you long-term focused research analysis driven by fundamental data. Note that our analysis may not factor in the latest price-sensitive company announcements or qualitative material.
If you spot an error that warrants correction, please contact the editor at editorial-team@simplywallst.com. This article by Simply Wall St is general in nature. It does not constitute a recommendation to buy or sell any stock, and does not take account of your objectives, or your financial situation. Simply Wall St has no position in the stocks mentioned. Thank you for reading.
