Does Formpipe Software AB (publ)'s (STO:FPIP) P/E Ratio Signal A Buying Opportunity?

Today, we'll introduce the concept of the P/E ratio for those who are learning about investing. We'll show how you can use Formpipe Software AB (publ)'s (STO:FPIP) P/E ratio to inform your assessment of the investment opportunity. What is Formpipe Software's P/E ratio? Well, based on the last twelve months it is 29.98. That corresponds to an earnings yield of approximately 3.3%.
See our latest analysis for Formpipe Software
How Do I Calculate A Price To Earnings Ratio?
The formula for price to earnings is:
Price to Earnings Ratio = Price per Share ÷ Earnings per Share (EPS)
Or for Formpipe Software:
P/E of 29.98 = SEK20.20 ÷ SEK0.67 (Based on the trailing twelve months to September 2019.)
Is A High P/E Ratio Good?
The higher the P/E ratio, the higher the price tag of a business, relative to its trailing earnings. That isn't a good or a bad thing on its own, but a high P/E means that buyers have a higher opinion of the business's prospects, relative to stocks with a lower P/E.
Does Formpipe Software Have A Relatively High Or Low P/E For Its Industry?
The P/E ratio indicates whether the market has higher or lower expectations of a company. We can see in the image below that the average P/E (43.5) for companies in the software industry is higher than Formpipe Software's P/E.
Formpipe Software's P/E tells us that market participants think it will not fare as well as its peers in the same industry. While current expectations are low, the stock could be undervalued if the situation is better than the market assumes. It is arguably worth checking if insiders are buying shares, because that might imply they believe the stock is undervalued.
How Growth Rates Impact P/E Ratios
P/E ratios primarily reflect market expectations around earnings growth rates. If earnings are growing quickly, then the 'E' in the equation will increase faster than it would otherwise. And in that case, the P/E ratio itself will drop rather quickly. Then, a lower P/E should attract more buyers, pushing the share price up.
Formpipe Software saw earnings per share decrease by 6.5% last year. But EPS is up 16% over the last 5 years.
Remember: P/E Ratios Don't Consider The Balance Sheet
One drawback of using a P/E ratio is that it considers market capitalization, but not the balance sheet. That means it doesn't take debt or cash into account. Hypothetically, a company could reduce its future P/E ratio by spending its cash (or taking on debt) to achieve higher earnings.
Spending on growth might be good or bad a few years later, but the point is that the P/E ratio does not account for the option (or lack thereof).
So What Does Formpipe Software's Balance Sheet Tell Us?
The extra options and safety that comes with Formpipe Software's kr33m net cash position means that it deserves a higher P/E than it would if it had a lot of net debt.
The Bottom Line On Formpipe Software's P/E Ratio
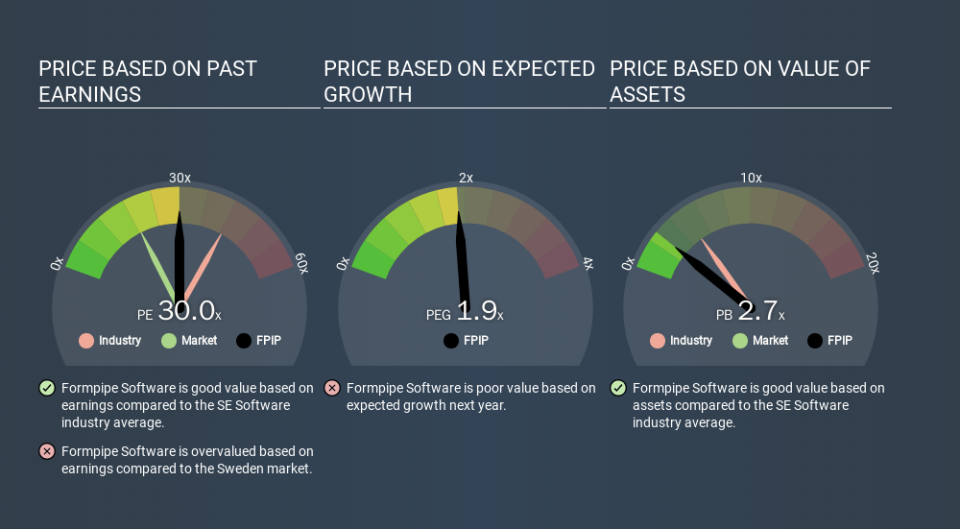
Formpipe Software has a P/E of 30.0. That's higher than the average in its market, which is 18.4. The recent drop in earnings per share might keep value investors away, but the net cash position means the company has time to improve: and the high P/E suggests the market thinks it will.
Investors should be looking to buy stocks that the market is wrong about. If the reality for a company is better than it expects, you can make money by buying and holding for the long term. So this free report on the analyst consensus forecasts could help you make a master move on this stock.
Of course, you might find a fantastic investment by looking at a few good candidates. So take a peek at this free list of companies with modest (or no) debt, trading on a P/E below 20.
If you spot an error that warrants correction, please contact the editor at editorial-team@simplywallst.com. This article by Simply Wall St is general in nature. It does not constitute a recommendation to buy or sell any stock, and does not take account of your objectives, or your financial situation. Simply Wall St has no position in the stocks mentioned.
We aim to bring you long-term focused research analysis driven by fundamental data. Note that our analysis may not factor in the latest price-sensitive company announcements or qualitative material. Thank you for reading.
