What Does G8 Education Limited's (ASX:GEM) P/E Ratio Tell You?

Today, we'll introduce the concept of the P/E ratio for those who are learning about investing. We'll look at G8 Education Limited's (ASX:GEM) P/E ratio and reflect on what it tells us about the company's share price. What is G8 Education's P/E ratio? Well, based on the last twelve months it is 19.16. That corresponds to an earnings yield of approximately 5.2%.
Want to participate in a short research study? Help shape the future of investing tools and you could win a $250 gift card!
Check out our latest analysis for G8 Education
How Do You Calculate A P/E Ratio?
The formula for price to earnings is:
Price to Earnings Ratio = Share Price ÷ Earnings per Share (EPS)
Or for G8 Education:
P/E of 19.16 = A$3.04 ÷ A$0.16 (Based on the trailing twelve months to December 2018.)
Is A High Price-to-Earnings Ratio Good?
A higher P/E ratio means that investors are paying a higher price for each A$1 of company earnings. That is not a good or a bad thing per se, but a high P/E does imply buyers are optimistic about the future.
How Growth Rates Impact P/E Ratios
Companies that shrink earnings per share quickly will rapidly decrease the 'E' in the equation. Therefore, even if you pay a low multiple of earnings now, that multiple will become higher in the future. A higher P/E should indicate the stock is expensive relative to others -- and that may encourage shareholders to sell.
G8 Education saw earnings per share decrease by 16% last year. But it has grown its earnings per share by 7.1% per year over the last five years. And EPS is down 13% a year, over the last 3 years. This growth rate might warrant a low P/E ratio.
Does G8 Education Have A Relatively High Or Low P/E For Its Industry?
One good way to get a quick read on what market participants expect of a company is to look at its P/E ratio. You can see in the image below that the average P/E (18.2) for companies in the consumer services industry is roughly the same as G8 Education's P/E.
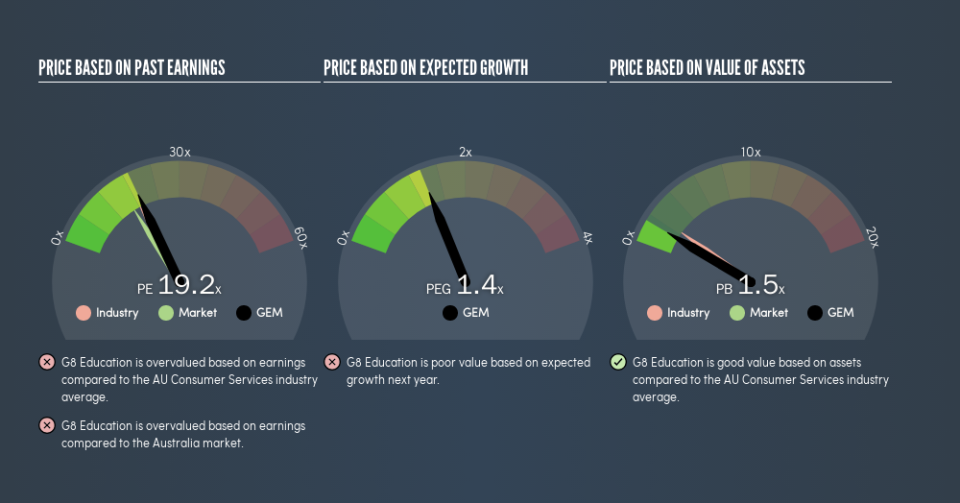
That indicates that the market expects G8 Education will perform roughly in line with other companies in its industry. The company could surprise by performing better than average, in the future. Checking factors such as the tenure of the board and management could help you form your own view on if that will happen.
A Limitation: P/E Ratios Ignore Debt and Cash In The Bank
One drawback of using a P/E ratio is that it considers market capitalization, but not the balance sheet. In other words, it does not consider any debt or cash that the company may have on the balance sheet. In theory, a company can lower its future P/E ratio by using cash or debt to invest in growth.
Such spending might be good or bad, overall, but the key point here is that you need to look at debt to understand the P/E ratio in context.
So What Does G8 Education's Balance Sheet Tell Us?
G8 Education has net debt worth 23% of its market capitalization. This could bring some additional risk, and reduce the number of investment options for management; worth remembering if you compare its P/E to businesses without debt.
The Verdict On G8 Education's P/E Ratio
G8 Education has a P/E of 19.2. That's higher than the average in the AU market, which is 16.3. With modest debt but no EPS growth in the last year, it's fair to say the P/E implies some optimism about future earnings, from the market.
When the market is wrong about a stock, it gives savvy investors an opportunity. If the reality for a company is better than it expects, you can make money by buying and holding for the long term. So this free visualization of the analyst consensus on future earnings could help you make the right decision about whether to buy, sell, or hold.
Of course you might be able to find a better stock than G8 Education. So you may wish to see this free collection of other companies that have grown earnings strongly.
We aim to bring you long-term focused research analysis driven by fundamental data. Note that our analysis may not factor in the latest price-sensitive company announcements or qualitative material.
If you spot an error that warrants correction, please contact the editor at editorial-team@simplywallst.com. This article by Simply Wall St is general in nature. It does not constitute a recommendation to buy or sell any stock, and does not take account of your objectives, or your financial situation. Simply Wall St has no position in the stocks mentioned. Thank you for reading.

