How Does Gallantt Ispat's (NSE:GALLISPAT) P/E Compare To Its Industry, After Its Big Share Price Gain?

Gallantt Ispat (NSE:GALLISPAT) shareholders are no doubt pleased to see that the share price has bounced 30% in the last month alone, although it is still down 38% over the last quarter. But shareholders may not all be feeling jubilant, since the share price is still down 40% in the last year.
All else being equal, a sharp share price increase should make a stock less attractive to potential investors. While the market sentiment towards a stock is very changeable, in the long run, the share price will tend to move in the same direction as earnings per share. The implication here is that deep value investors might steer clear when expectations of a company are too high. One way to gauge market expectations of a stock is to look at its Price to Earnings Ratio (PE Ratio). A high P/E ratio means that investors have a high expectation about future growth, while a low P/E ratio means they have low expectations about future growth.
View our latest analysis for Gallantt Ispat
Does Gallantt Ispat Have A Relatively High Or Low P/E For Its Industry?
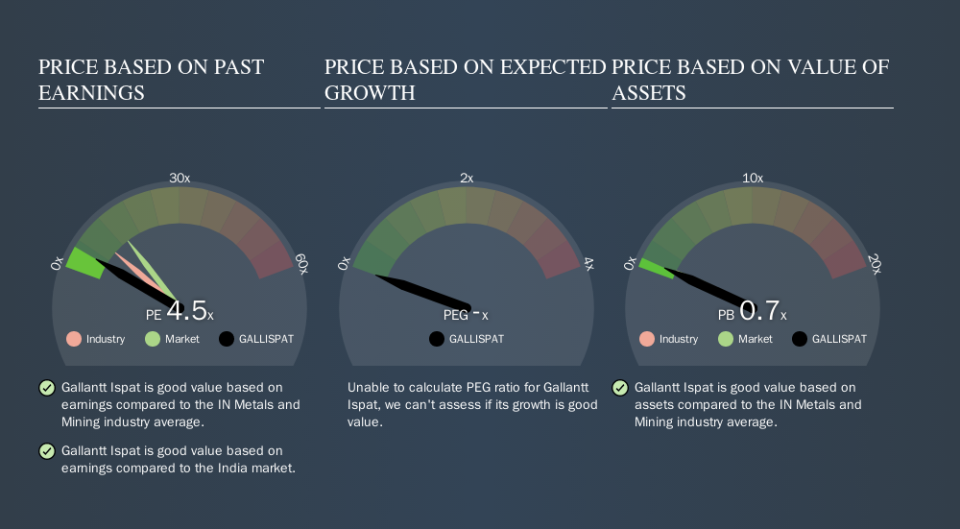
We can tell from its P/E ratio of 4.47 that sentiment around Gallantt Ispat isn't particularly high. We can see in the image below that the average P/E (8.9) for companies in the metals and mining industry is higher than Gallantt Ispat's P/E.
This suggests that market participants think Gallantt Ispat will underperform other companies in its industry. Since the market seems unimpressed with Gallantt Ispat, it's quite possible it could surprise on the upside. If you consider the stock interesting, further research is recommended. For example, I often monitor director buying and selling.
How Growth Rates Impact P/E Ratios
Earnings growth rates have a big influence on P/E ratios. If earnings are growing quickly, then the 'E' in the equation will increase faster than it would otherwise. That means unless the share price increases, the P/E will reduce in a few years. A lower P/E should indicate the stock is cheap relative to others -- and that may attract buyers.
It's nice to see that Gallantt Ispat grew EPS by a stonking 40% in the last year. And earnings per share have improved by 49% annually, over the last five years. I'd therefore be a little surprised if its P/E ratio was not relatively high.
Remember: P/E Ratios Don't Consider The Balance Sheet
The 'Price' in P/E reflects the market capitalization of the company. That means it doesn't take debt or cash into account. In theory, a company can lower its future P/E ratio by using cash or debt to invest in growth.
Such spending might be good or bad, overall, but the key point here is that you need to look at debt to understand the P/E ratio in context.
Is Debt Impacting Gallantt Ispat's P/E?
The extra options and safety that comes with Gallantt Ispat's ₹70m net cash position means that it deserves a higher P/E than it would if it had a lot of net debt.
The Verdict On Gallantt Ispat's P/E Ratio
Gallantt Ispat's P/E is 4.5 which is below average (14.0) in the IN market. Not only should the net cash position reduce risk, but the recent growth has been impressive. The below average P/E ratio suggests that market participants don't believe the strong growth will continue. What is very clear is that the market has become less pessimistic about Gallantt Ispat over the last month, with the P/E ratio rising from 3.4 back then to 4.5 today. If you like to buy stocks that could be turnaround opportunities, then this one might be a candidate; but if you're more sensitive to price, then you may feel the opportunity has passed.
Investors should be looking to buy stocks that the market is wrong about. If it is underestimating a company, investors can make money by buying and holding the shares until the market corrects itself. We don't have analyst forecasts, but shareholders might want to examine this detailed historical graph of earnings, revenue and cash flow.
Of course you might be able to find a better stock than Gallantt Ispat. So you may wish to see this free collection of other companies that have grown earnings strongly.
We aim to bring you long-term focused research analysis driven by fundamental data. Note that our analysis may not factor in the latest price-sensitive company announcements or qualitative material.
If you spot an error that warrants correction, please contact the editor at editorial-team@simplywallst.com. This article by Simply Wall St is general in nature. It does not constitute a recommendation to buy or sell any stock, and does not take account of your objectives, or your financial situation. Simply Wall St has no position in the stocks mentioned. Thank you for reading.

