Does Gallantt Metal Limited (NSE:GALLANTT) Have A Good P/E Ratio?

This article is written for those who want to get better at using price to earnings ratios (P/E ratios). To keep it practical, we'll show how Gallantt Metal Limited's (NSE:GALLANTT) P/E ratio could help you assess the value on offer. Gallantt Metal has a price to earnings ratio of 3.31, based on the last twelve months. That is equivalent to an earnings yield of about 30%.
Want to participate in a short research study? Help shape the future of investing tools and you could win a $250 gift card!
Check out our latest analysis for Gallantt Metal
How Do You Calculate A P/E Ratio?
The formula for price to earnings is:
Price to Earnings Ratio = Price per Share ÷ Earnings per Share (EPS)
Or for Gallantt Metal:
P/E of 3.31 = ₹42.5 ÷ ₹12.83 (Based on the trailing twelve months to March 2019.)
Is A High Price-to-Earnings Ratio Good?
The higher the P/E ratio, the higher the price tag of a business, relative to its trailing earnings. All else being equal, it's better to pay a low price -- but as Warren Buffett said, 'It's far better to buy a wonderful company at a fair price than a fair company at a wonderful price.'
How Growth Rates Impact P/E Ratios
Probably the most important factor in determining what P/E a company trades on is the earnings growth. If earnings are growing quickly, then the 'E' in the equation will increase faster than it would otherwise. That means even if the current P/E is high, it will reduce over time if the share price stays flat. And as that P/E ratio drops, the company will look cheap, unless its share price increases.
Gallantt Metal's earnings made like a rocket, taking off 66% last year. The cherry on top is that the five year growth rate was an impressive 47% per year. So I'd be surprised if the P/E ratio was not above average.
Does Gallantt Metal Have A Relatively High Or Low P/E For Its Industry?
One good way to get a quick read on what market participants expect of a company is to look at its P/E ratio. We can see in the image below that the average P/E (10) for companies in the metals and mining industry is higher than Gallantt Metal's P/E.
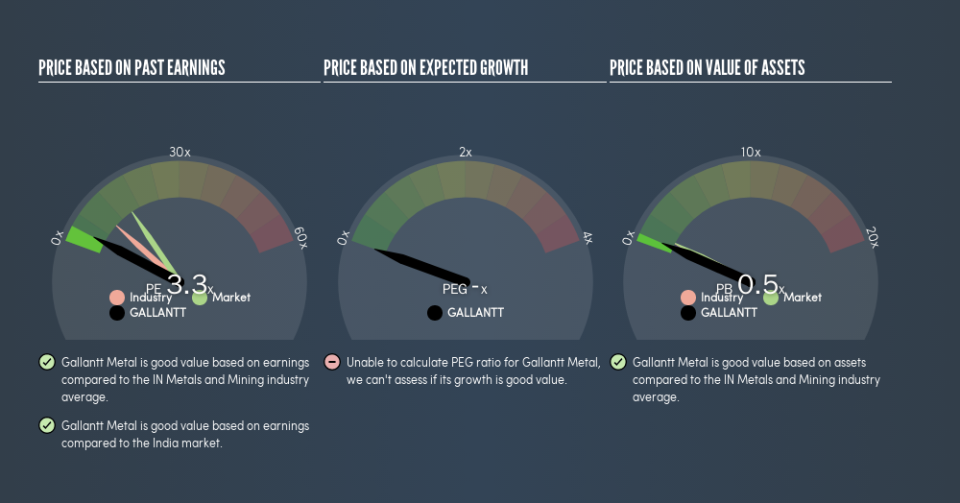
Gallantt Metal's P/E tells us that market participants think it will not fare as well as its peers in the same industry. Since the market seems unimpressed with Gallantt Metal, it's quite possible it could surprise on the upside. If you consider the stock interesting, further research is recommended. For example, I often monitor director buying and selling.
Remember: P/E Ratios Don't Consider The Balance Sheet
One drawback of using a P/E ratio is that it considers market capitalization, but not the balance sheet. Thus, the metric does not reflect cash or debt held by the company. Theoretically, a business can improve its earnings (and produce a lower P/E in the future) by investing in growth. That means taking on debt (or spending its cash).
Spending on growth might be good or bad a few years later, but the point is that the P/E ratio does not account for the option (or lack thereof).
Gallantt Metal's Balance Sheet
Gallantt Metal's net debt is 14% of its market cap. That's enough debt to impact the P/E ratio a little; so keep it in mind if you're comparing it to companies without debt.
The Verdict On Gallantt Metal's P/E Ratio
Gallantt Metal trades on a P/E ratio of 3.3, which is below the IN market average of 15.4. The EPS growth last year was strong, and debt levels are quite reasonable. If it continues to grow, then the current low P/E may prove to be unjustified.
When the market is wrong about a stock, it gives savvy investors an opportunity. If the reality for a company is not as bad as the P/E ratio indicates, then the share price should increase as the market realizes this. Although we don't have analyst forecasts, shareholders might want to examine this detailed historical graph of earnings, revenue and cash flow.
Of course, you might find a fantastic investment by looking at a few good candidates. So take a peek at this free list of companies with modest (or no) debt, trading on a P/E below 20.
We aim to bring you long-term focused research analysis driven by fundamental data. Note that our analysis may not factor in the latest price-sensitive company announcements or qualitative material.
If you spot an error that warrants correction, please contact the editor at editorial-team@simplywallst.com. This article by Simply Wall St is general in nature. It does not constitute a recommendation to buy or sell any stock, and does not take account of your objectives, or your financial situation. Simply Wall St has no position in the stocks mentioned. Thank you for reading.

