Does Godawari Power & Ispat Limited (NSE:GPIL) Have A Good P/E Ratio?

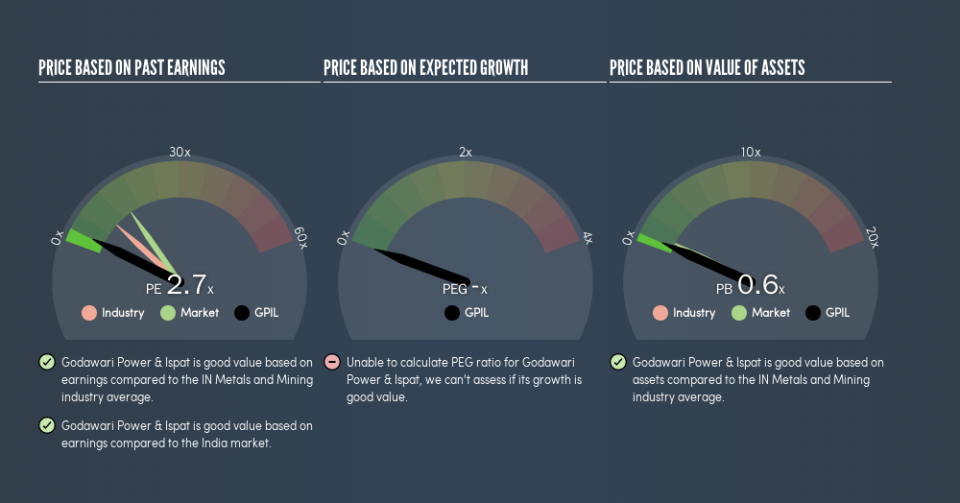
Today, we'll introduce the concept of the P/E ratio for those who are learning about investing. We'll look at Godawari Power & Ispat Limited's (NSE:GPIL) P/E ratio and reflect on what it tells us about the company's share price. Looking at earnings over the last twelve months, Godawari Power & Ispat has a P/E ratio of 2.73. That corresponds to an earnings yield of approximately 37%.
Want to participate in a short research study? Help shape the future of investing tools and you could win a $250 gift card!
View our latest analysis for Godawari Power & Ispat
How Do You Calculate A P/E Ratio?
The formula for P/E is:
Price to Earnings Ratio = Share Price ÷ Earnings per Share (EPS)
Or for Godawari Power & Ispat:
P/E of 2.73 = ₹195.2 ÷ ₹71.55 (Based on the trailing twelve months to March 2019.)
Is A High Price-to-Earnings Ratio Good?
A higher P/E ratio implies that investors pay a higher price for the earning power of the business. That is not a good or a bad thing per se, but a high P/E does imply buyers are optimistic about the future.
How Growth Rates Impact P/E Ratios
P/E ratios primarily reflect market expectations around earnings growth rates. When earnings grow, the 'E' increases, over time. That means unless the share price increases, the P/E will reduce in a few years. And as that P/E ratio drops, the company will look cheap, unless its share price increases.
It's great to see that Godawari Power & Ispat grew EPS by 21% in the last year. And earnings per share have improved by 32% annually, over the last five years. So one might expect an above average P/E ratio.
How Does Godawari Power & Ispat's P/E Ratio Compare To Its Peers?
We can get an indication of market expectations by looking at the P/E ratio. If you look at the image below, you can see Godawari Power & Ispat has a lower P/E than the average (9.6) in the metals and mining industry classification.
This suggests that market participants think Godawari Power & Ispat will underperform other companies in its industry. While current expectations are low, the stock could be undervalued if the situation is better than the market assumes. You should delve deeper. I like to check if company insiders have been buying or selling.
Remember: P/E Ratios Don't Consider The Balance Sheet
One drawback of using a P/E ratio is that it considers market capitalization, but not the balance sheet. Thus, the metric does not reflect cash or debt held by the company. In theory, a company can lower its future P/E ratio by using cash or debt to invest in growth.
Such expenditure might be good or bad, in the long term, but the point here is that the balance sheet is not reflected by this ratio.
So What Does Godawari Power & Ispat's Balance Sheet Tell Us?
Godawari Power & Ispat has net debt worth a very significant 269% of its market capitalization. This is a relatively high level of debt, so the stock probably deserves a relatively low P/E ratio. Keep that in mind when comparing it to other companies.
The Verdict On Godawari Power & Ispat's P/E Ratio
Godawari Power & Ispat has a P/E of 2.7. That's below the average in the IN market, which is 15.1. While the EPS growth last year was strong, the significant debt levels reduce the number of options available to management. If it continues to grow, then the current low P/E may prove to be unjustified.
Investors have an opportunity when market expectations about a stock are wrong. If the reality for a company is not as bad as the P/E ratio indicates, then the share price should increase as the market realizes this. So this free visualization of the analyst consensus on future earnings could help you make the right decision about whether to buy, sell, or hold.
Of course, you might find a fantastic investment by looking at a few good candidates. So take a peek at this free list of companies with modest (or no) debt, trading on a P/E below 20.
We aim to bring you long-term focused research analysis driven by fundamental data. Note that our analysis may not factor in the latest price-sensitive company announcements or qualitative material.
If you spot an error that warrants correction, please contact the editor at editorial-team@simplywallst.com. This article by Simply Wall St is general in nature. It does not constitute a recommendation to buy or sell any stock, and does not take account of your objectives, or your financial situation. Simply Wall St has no position in the stocks mentioned. Thank you for reading.

