What Does Greencore Group plc's (LON:GNC) P/E Ratio Tell You?

This article is written for those who want to get better at using price to earnings ratios (P/E ratios). We'll look at Greencore Group plc's (LON:GNC) P/E ratio and reflect on what it tells us about the company's share price. Based on the last twelve months, Greencore Group's P/E ratio is 32.46. In other words, at today's prices, investors are paying £32.46 for every £1 in prior year profit.
See our latest analysis for Greencore Group
How Do You Calculate A P/E Ratio?
The formula for price to earnings is:
Price to Earnings Ratio = Share Price ÷ Earnings per Share (EPS)
Or for Greencore Group:
P/E of 32.46 = GBP2.51 ÷ GBP0.08 (Based on the trailing twelve months to September 2019.)
Is A High P/E Ratio Good?
A higher P/E ratio means that buyers have to pay a higher price for each GBP1 the company has earned over the last year. That isn't a good or a bad thing on its own, but a high P/E means that buyers have a higher opinion of the business's prospects, relative to stocks with a lower P/E.
How Does Greencore Group's P/E Ratio Compare To Its Peers?
One good way to get a quick read on what market participants expect of a company is to look at its P/E ratio. The image below shows that Greencore Group has a higher P/E than the average (16.9) P/E for companies in the food industry.
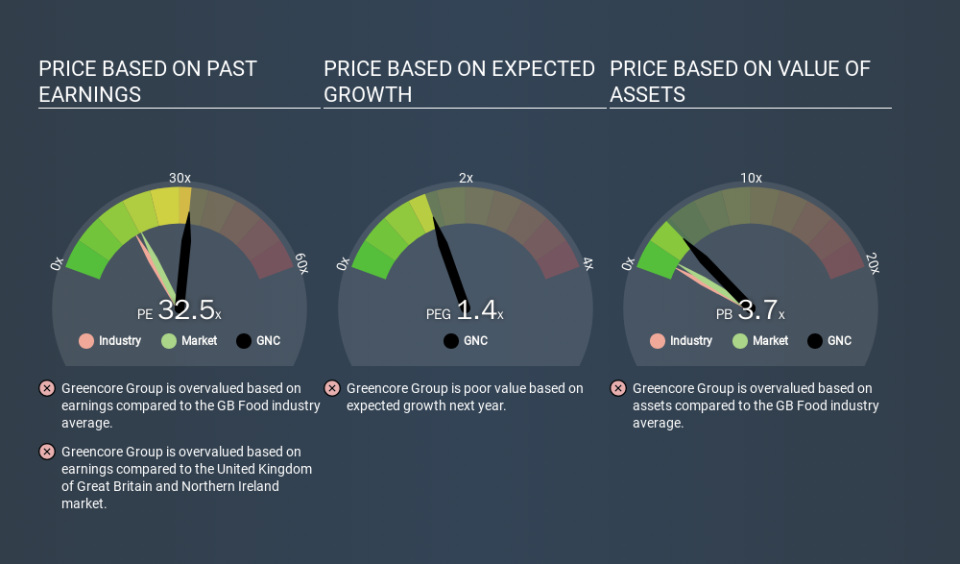
Its relatively high P/E ratio indicates that Greencore Group shareholders think it will perform better than other companies in its industry classification. Shareholders are clearly optimistic, but the future is always uncertain. So investors should always consider the P/E ratio alongside other factors, such as whether company directors have been buying shares.
How Growth Rates Impact P/E Ratios
Companies that shrink earnings per share quickly will rapidly decrease the 'E' in the equation. Therefore, even if you pay a low multiple of earnings now, that multiple will become higher in the future. A higher P/E should indicate the stock is expensive relative to others -- and that may encourage shareholders to sell.
In the last year, Greencore Group grew EPS like Taylor Swift grew her fan base back in 2010; the 451% gain was both fast and well deserved. Unfortunately, earnings per share are down 8.1% a year, over 5 years.
Remember: P/E Ratios Don't Consider The Balance Sheet
The 'Price' in P/E reflects the market capitalization of the company. Thus, the metric does not reflect cash or debt held by the company. The exact same company would hypothetically deserve a higher P/E ratio if it had a strong balance sheet, than if it had a weak one with lots of debt, because a cashed up company can spend on growth.
Spending on growth might be good or bad a few years later, but the point is that the P/E ratio does not account for the option (or lack thereof).
Is Debt Impacting Greencore Group's P/E?
Net debt is 26% of Greencore Group's market cap. While that's enough to warrant consideration, it doesn't really concern us.
The Bottom Line On Greencore Group's P/E Ratio
Greencore Group trades on a P/E ratio of 32.5, which is above its market average of 18.6. Its debt levels do not imperil its balance sheet and its EPS growth is very healthy indeed. So to be frank we are not surprised it has a high P/E ratio.
When the market is wrong about a stock, it gives savvy investors an opportunity. As value investor Benjamin Graham famously said, 'In the short run, the market is a voting machine but in the long run, it is a weighing machine. So this free visualization of the analyst consensus on future earnings could help you make the right decision about whether to buy, sell, or hold.
You might be able to find a better buy than Greencore Group. If you want a selection of possible winners, check out this free list of interesting companies that trade on a P/E below 20 (but have proven they can grow earnings).
If you spot an error that warrants correction, please contact the editor at editorial-team@simplywallst.com. This article by Simply Wall St is general in nature. It does not constitute a recommendation to buy or sell any stock, and does not take account of your objectives, or your financial situation. Simply Wall St has no position in the stocks mentioned.
We aim to bring you long-term focused research analysis driven by fundamental data. Note that our analysis may not factor in the latest price-sensitive company announcements or qualitative material. Thank you for reading.

