What Does Grupo Empresarial San José, S.A.'s (BME:GSJ) P/E Ratio Tell You?

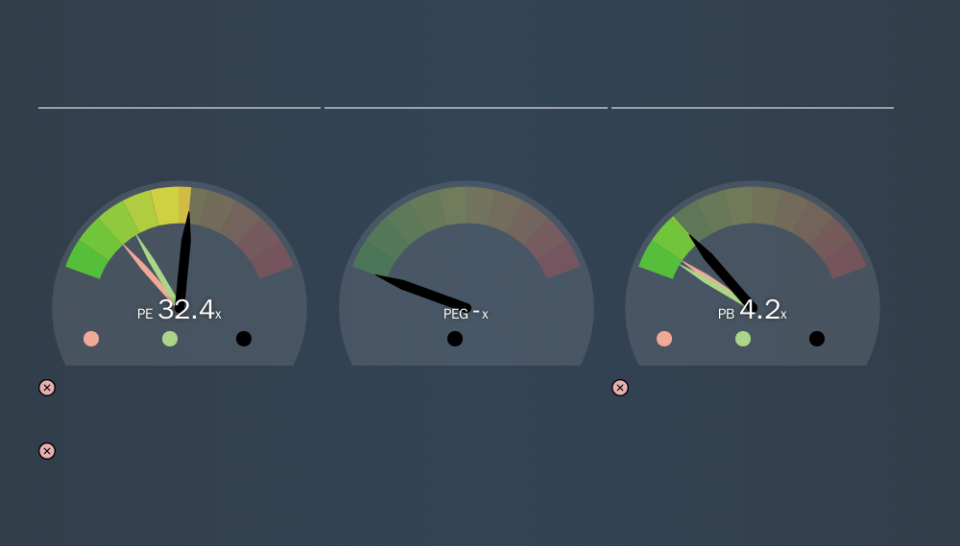
The goal of this article is to teach you how to use price to earnings ratios (P/E ratios). We'll show how you can use Grupo Empresarial San José, S.A.'s (BME:GSJ) P/E ratio to inform your assessment of the investment opportunity. Based on the last twelve months, Grupo Empresarial San José's P/E ratio is 32.40. In other words, at today's prices, investors are paying €32.40 for every €1 in prior year profit.
Check out our latest analysis for Grupo Empresarial San José
How Do You Calculate A P/E Ratio?
The formula for price to earnings is:
Price to Earnings Ratio = Share Price ÷ Earnings per Share (EPS)
Or for Grupo Empresarial San José:
P/E of 32.40 = €6.71 ÷ €0.21 (Based on the trailing twelve months to September 2019.)
Is A High Price-to-Earnings Ratio Good?
The higher the P/E ratio, the higher the price tag of a business, relative to its trailing earnings. That is not a good or a bad thing per se, but a high P/E does imply buyers are optimistic about the future.
Does Grupo Empresarial San José Have A Relatively High Or Low P/E For Its Industry?
The P/E ratio indicates whether the market has higher or lower expectations of a company. You can see in the image below that the average P/E (12.2) for companies in the construction industry is lower than Grupo Empresarial San José's P/E.
Grupo Empresarial San José's P/E tells us that market participants think the company will perform better than its industry peers, going forward. The market is optimistic about the future, but that doesn't guarantee future growth. So investors should always consider the P/E ratio alongside other factors, such as whether company directors have been buying shares.
How Growth Rates Impact P/E Ratios
Generally speaking the rate of earnings growth has a profound impact on a company's P/E multiple. If earnings are growing quickly, then the 'E' in the equation will increase faster than it would otherwise. And in that case, the P/E ratio itself will drop rather quickly. Then, a lower P/E should attract more buyers, pushing the share price up.
Most would be impressed by Grupo Empresarial San José earnings growth of 15% in the last year.
A Limitation: P/E Ratios Ignore Debt and Cash In The Bank
Don't forget that the P/E ratio considers market capitalization. That means it doesn't take debt or cash into account. Theoretically, a business can improve its earnings (and produce a lower P/E in the future) by investing in growth. That means taking on debt (or spending its cash).
Such expenditure might be good or bad, in the long term, but the point here is that the balance sheet is not reflected by this ratio.
Is Debt Impacting Grupo Empresarial San José's P/E?
Since Grupo Empresarial San José holds net cash of €35m, it can spend on growth, justifying a higher P/E ratio than otherwise.
The Verdict On Grupo Empresarial San José's P/E Ratio
Grupo Empresarial San José trades on a P/E ratio of 32.4, which is above its market average of 16.7. Its net cash position supports a higher P/E ratio, as does its solid recent earnings growth. So it does not seem strange that the P/E is above average.
Investors have an opportunity when market expectations about a stock are wrong. People often underestimate remarkable growth -- so investors can make money when fast growth is not fully appreciated. We don't have analyst forecasts, but you might want to assess this data-rich visualization of earnings, revenue and cash flow.
Of course, you might find a fantastic investment by looking at a few good candidates. So take a peek at this free list of companies with modest (or no) debt, trading on a P/E below 20.
We aim to bring you long-term focused research analysis driven by fundamental data. Note that our analysis may not factor in the latest price-sensitive company announcements or qualitative material.
If you spot an error that warrants correction, please contact the editor at editorial-team@simplywallst.com. This article by Simply Wall St is general in nature. It does not constitute a recommendation to buy or sell any stock, and does not take account of your objectives, or your financial situation. Simply Wall St has no position in the stocks mentioned. Thank you for reading.
