How Does Guangdong Kanghua Healthcare's (HKG:3689) P/E Compare To Its Industry, After The Share Price Drop?

Unfortunately for some shareholders, the Guangdong Kanghua Healthcare (HKG:3689) share price has dived 32% in the last thirty days. That drop has capped off a tough year for shareholders, with the share price down 55% in that time.
All else being equal, a share price drop should make a stock more attractive to potential investors. In the long term, share prices tend to follow earnings per share, but in the short term prices bounce around in response to short term factors (which are not always obvious). The implication here is that long term investors have an opportunity when expectations of a company are too low. Perhaps the simplest way to get a read on investors' expectations of a business is to look at its Price to Earnings Ratio (PE Ratio). Investors have optimistic expectations of companies with higher P/E ratios, compared to companies with lower P/E ratios.
View our latest analysis for Guangdong Kanghua Healthcare
Does Guangdong Kanghua Healthcare Have A Relatively High Or Low P/E For Its Industry?
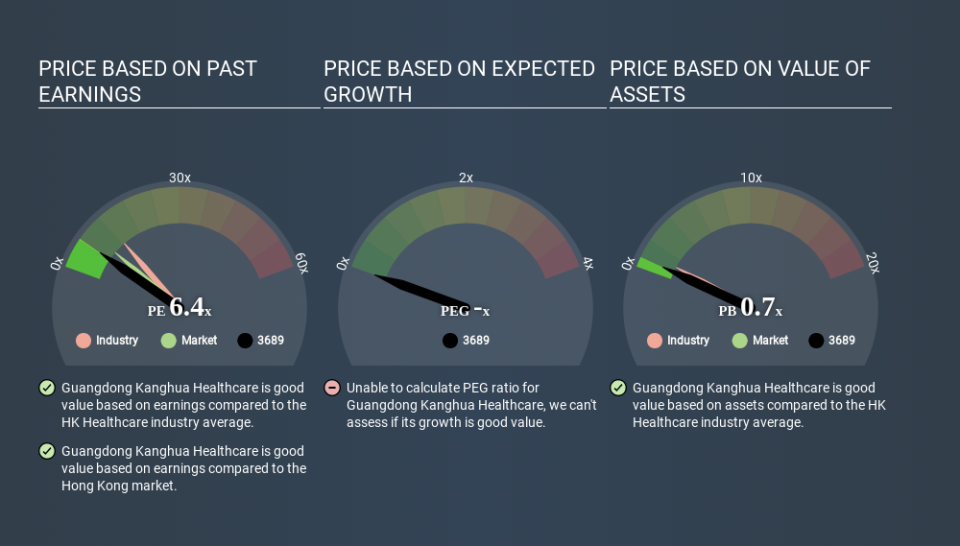
Guangdong Kanghua Healthcare's P/E of 6.38 indicates relatively low sentiment towards the stock. If you look at the image below, you can see Guangdong Kanghua Healthcare has a lower P/E than the average (12.6) in the healthcare industry classification.
This suggests that market participants think Guangdong Kanghua Healthcare will underperform other companies in its industry. Many investors like to buy stocks when the market is pessimistic about their prospects. If you consider the stock interesting, further research is recommended. For example, I often monitor director buying and selling.
How Growth Rates Impact P/E Ratios
When earnings fall, the 'E' decreases, over time. That means even if the current P/E is low, it will increase over time if the share price stays flat. A higher P/E should indicate the stock is expensive relative to others -- and that may encourage shareholders to sell.
Guangdong Kanghua Healthcare's earnings per share fell by 12% in the last twelve months. And it has shrunk its earnings per share by 1.9% per year over the last three years. This could justify a low P/E.
Don't Forget: The P/E Does Not Account For Debt or Bank Deposits
Don't forget that the P/E ratio considers market capitalization. That means it doesn't take debt or cash into account. In theory, a company can lower its future P/E ratio by using cash or debt to invest in growth.
Such spending might be good or bad, overall, but the key point here is that you need to look at debt to understand the P/E ratio in context.
How Does Guangdong Kanghua Healthcare's Debt Impact Its P/E Ratio?
With net cash of CN¥491m, Guangdong Kanghua Healthcare has a very strong balance sheet, which may be important for its business. Having said that, at 51% of its market capitalization the cash hoard would contribute towards a higher P/E ratio.
The Verdict On Guangdong Kanghua Healthcare's P/E Ratio
Guangdong Kanghua Healthcare's P/E is 6.4 which is below average (8.9) in the HK market. The recent drop in earnings per share would make investors cautious, the relatively strong balance sheet will allow the company time to invest in growth. If it achieves that, then there's real potential that the low P/E could eventually indicate undervaluation. Given Guangdong Kanghua Healthcare's P/E ratio has declined from 9.4 to 6.4 in the last month, we know for sure that the market is more worried about the business today, than it was back then. For those who prefer to invest with the flow of momentum, that might be a bad sign, but for deep value investors this stock might justify some research.
Investors have an opportunity when market expectations about a stock are wrong. If the reality for a company is not as bad as the P/E ratio indicates, then the share price should increase as the market realizes this. We don't have analyst forecasts, but you could get a better understanding of its growth by checking out this more detailed historical graph of earnings, revenue and cash flow.
Of course, you might find a fantastic investment by looking at a few good candidates. So take a peek at this free list of companies with modest (or no) debt, trading on a P/E below 20.
If you spot an error that warrants correction, please contact the editor at editorial-team@simplywallst.com. This article by Simply Wall St is general in nature. It does not constitute a recommendation to buy or sell any stock, and does not take account of your objectives, or your financial situation. Simply Wall St has no position in the stocks mentioned.
We aim to bring you long-term focused research analysis driven by fundamental data. Note that our analysis may not factor in the latest price-sensitive company announcements or qualitative material. Thank you for reading.
